
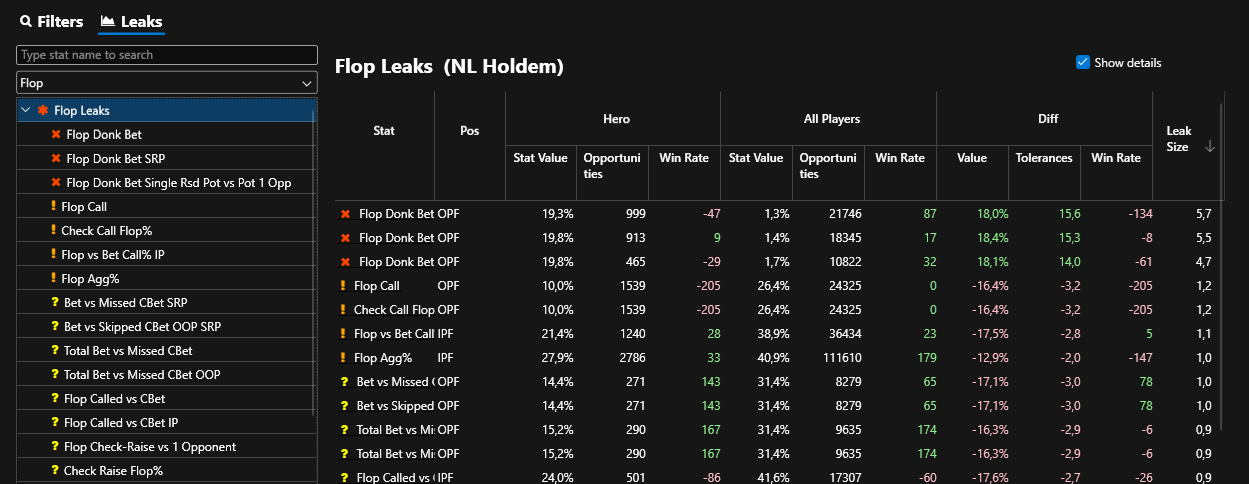
1. Stat List
The stat list column on the left allows you to quickly see where your biggest leaks are. Leak Explorer automatically sorts leaks by severity and lists your biggest leaks at the top.
Search for a specific stat at the very top of this column and right below the search you can use the dropdown to filter for the following street stats:
- Preflop
- Postflop
- Flop
- Turn
- River
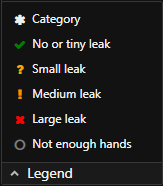
Stat List Legend
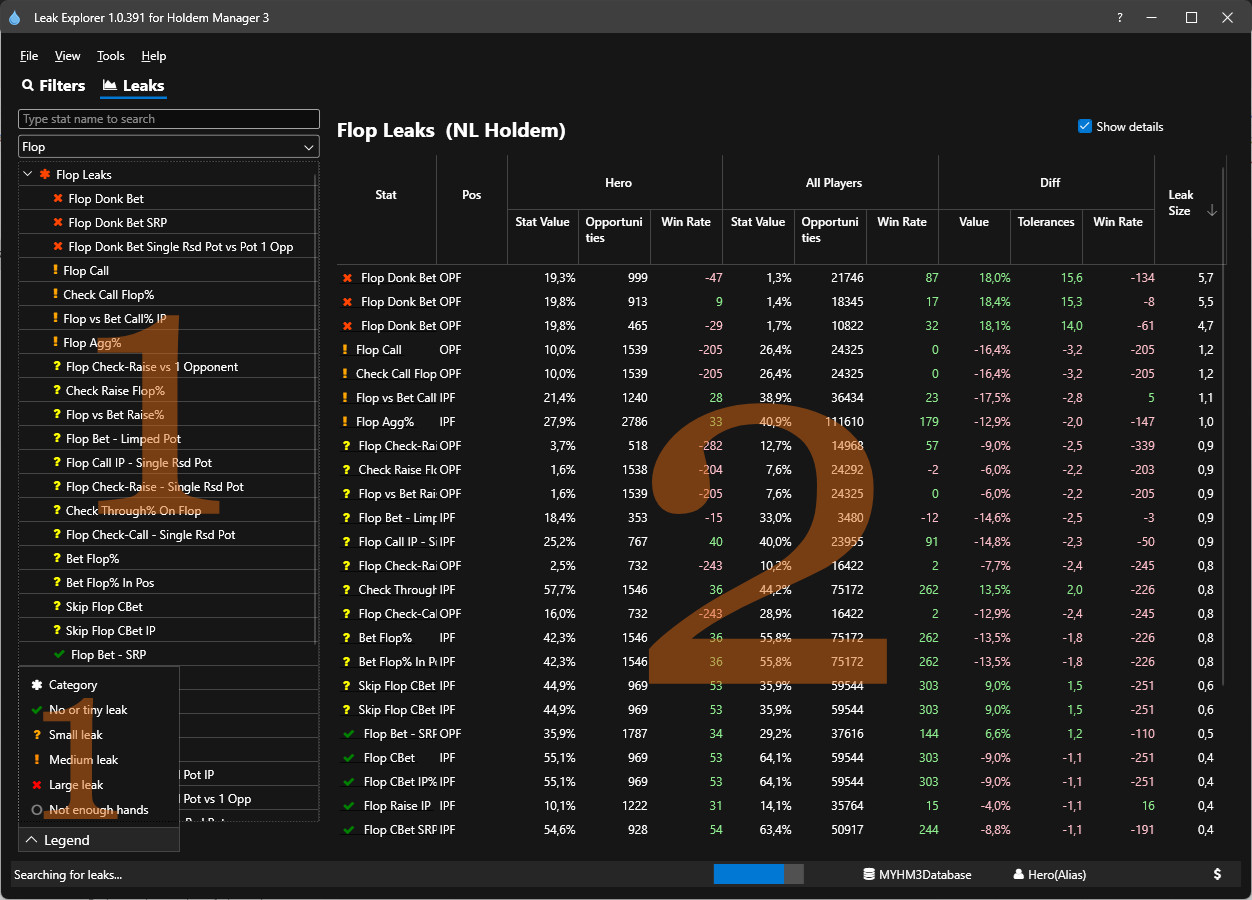
2. Leaks - Main Window
Leak Size Defined: (How is Leak Size Calculated FAQ - Click Here)
Leak Explorer looks at the differences in your Stat Value & Win Rate vs. the Winning Players Stat Value & Win Rate along with Opportunity Counts to come up with the Leak Size.
*If the Hero Stat Win Rate is better than the Winning Players, Leak Explorer automatically gives the stat a (No Leak) status.
or
The size of the leak (Abs(StatValueDiff) * WinRateDiff * OpportunityCount / MaxOpportunityCount)
1. The show details checkbox in the top-right adds the Opportunities & Win Rate columns.
2. Clicking a stat will open a detailed view of the selected stat broken down by position. (See Below)
Leak - Specifics
- Leak Specifics By Position
- Day
- Winning players
- Hole Cards
- Hand groups
- Session duration
- Hour of day
- Day of the week
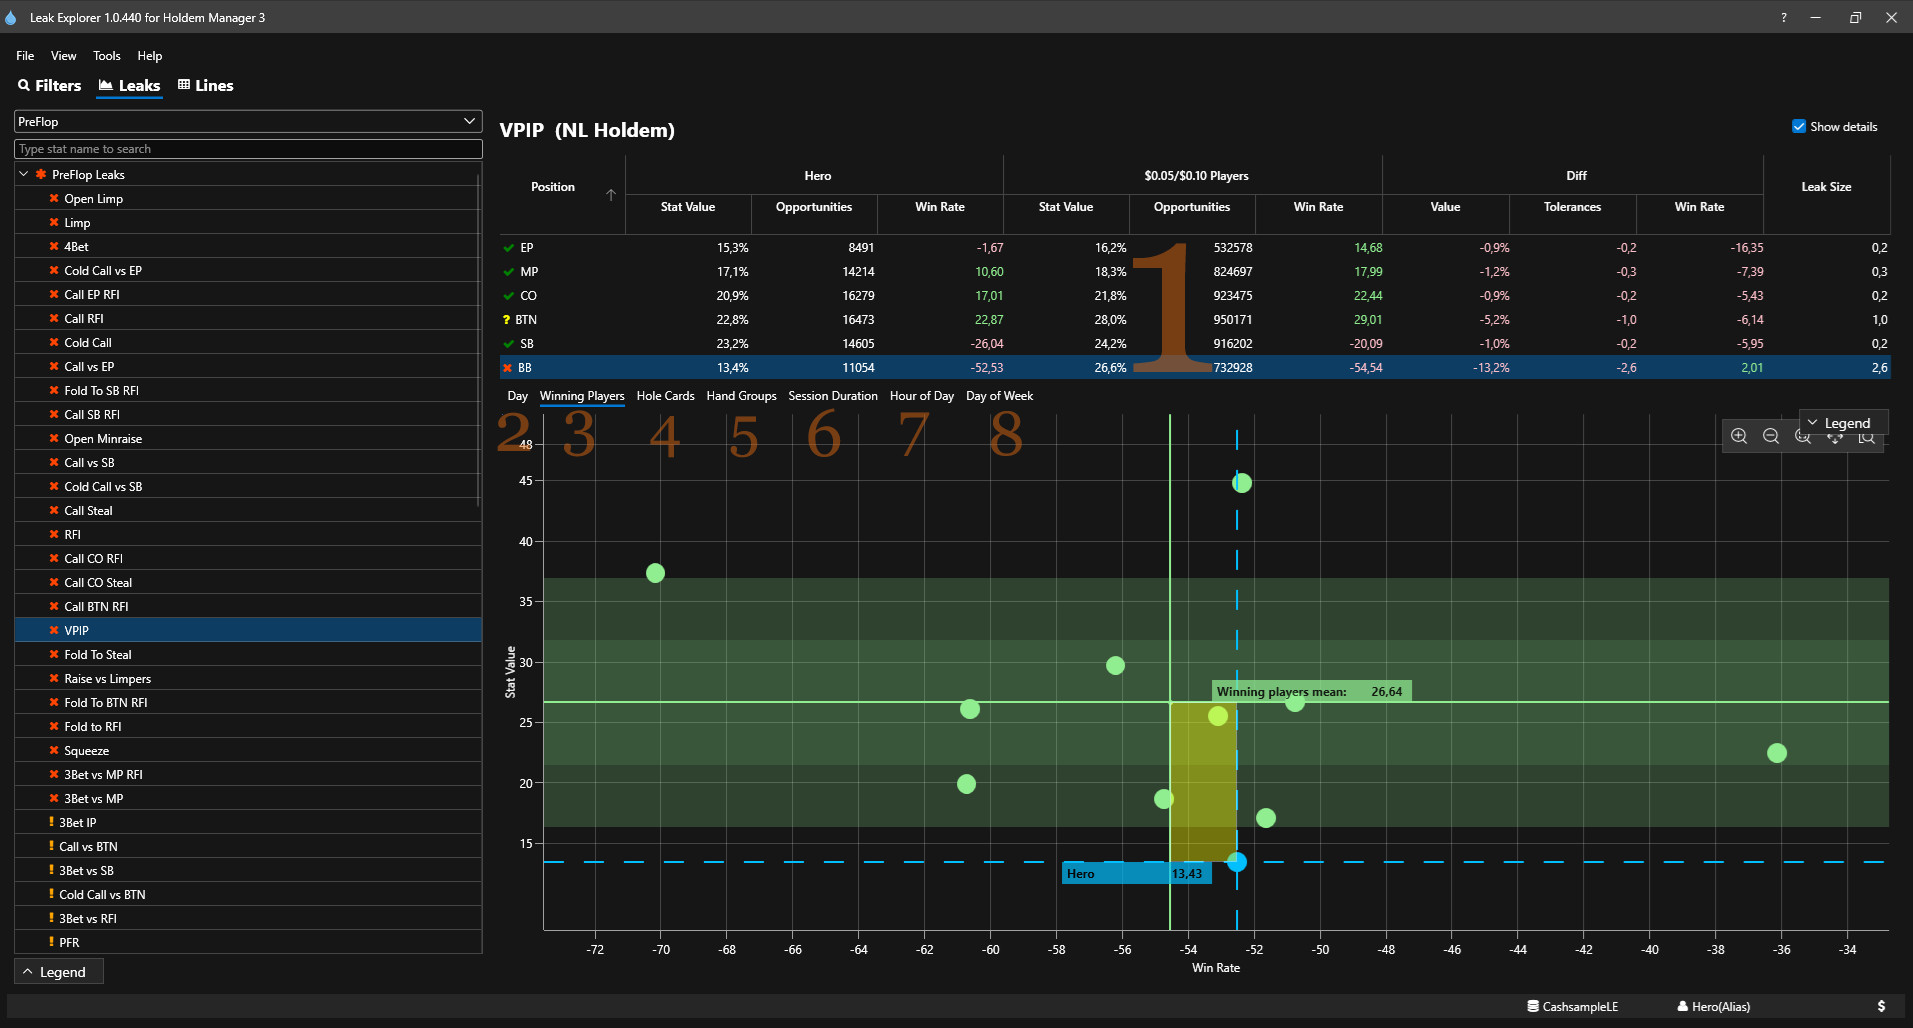
Leak Specifics By Position
This is the same as the (Leaks - Main Window) but with the selected stat broken down by positions. In the screen above, the VPIP stat is broken down by positions.
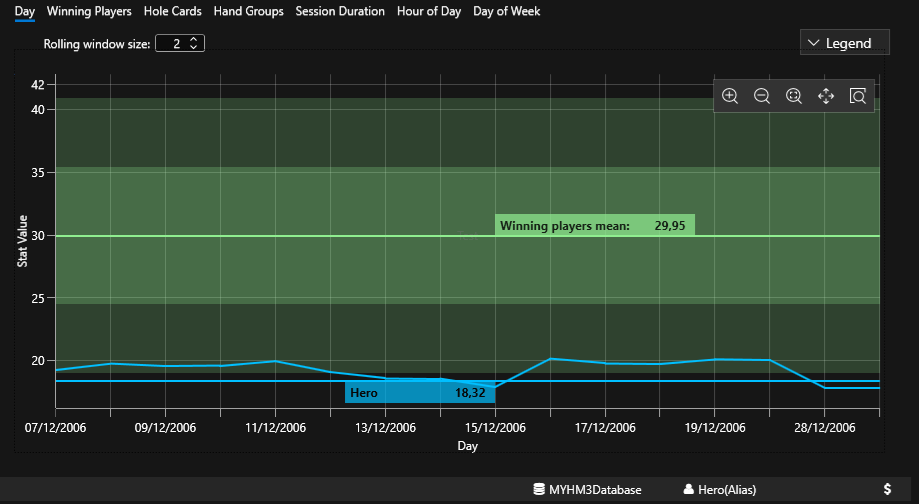
The Day Tab displays a chart showing your win rate by day compared to winning players. It allows to understand how well you are doing by day and understand if there are some days that are better or worse repeatedly.
Winning Players tab
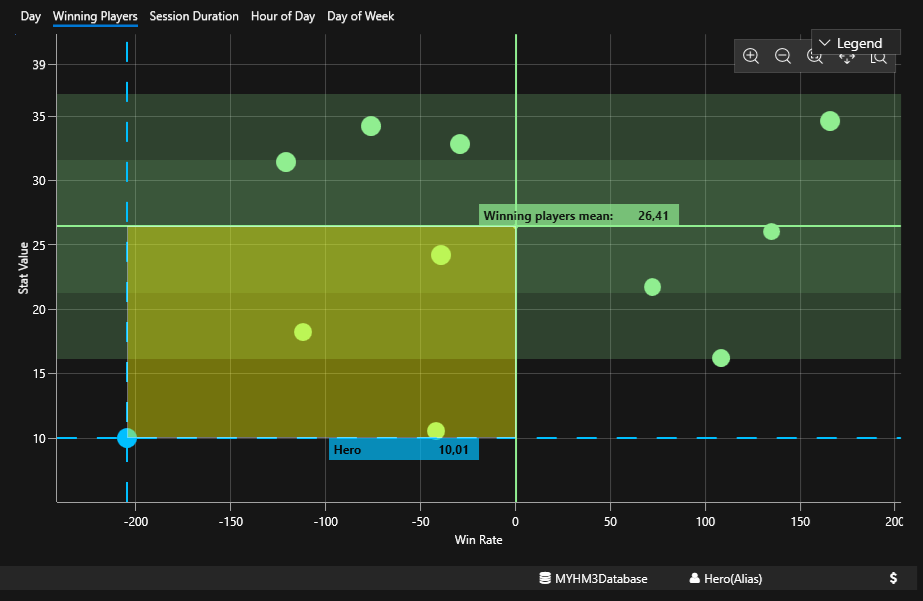
The easiest way to look at this chart is to focus on the box size. (Orange box above) Bigger the box = bigger the leak
Next, open up the legend on the right and you'll notice the box color changes based on if your stat value is too "loose" or "tight vs the Winning Players.
The green circles represent each individual Winning Player. Hover over a player to see specifics about that player. Leak Explorer weights each player differently based on their stat value and win rate vs the average for all Winning Players.
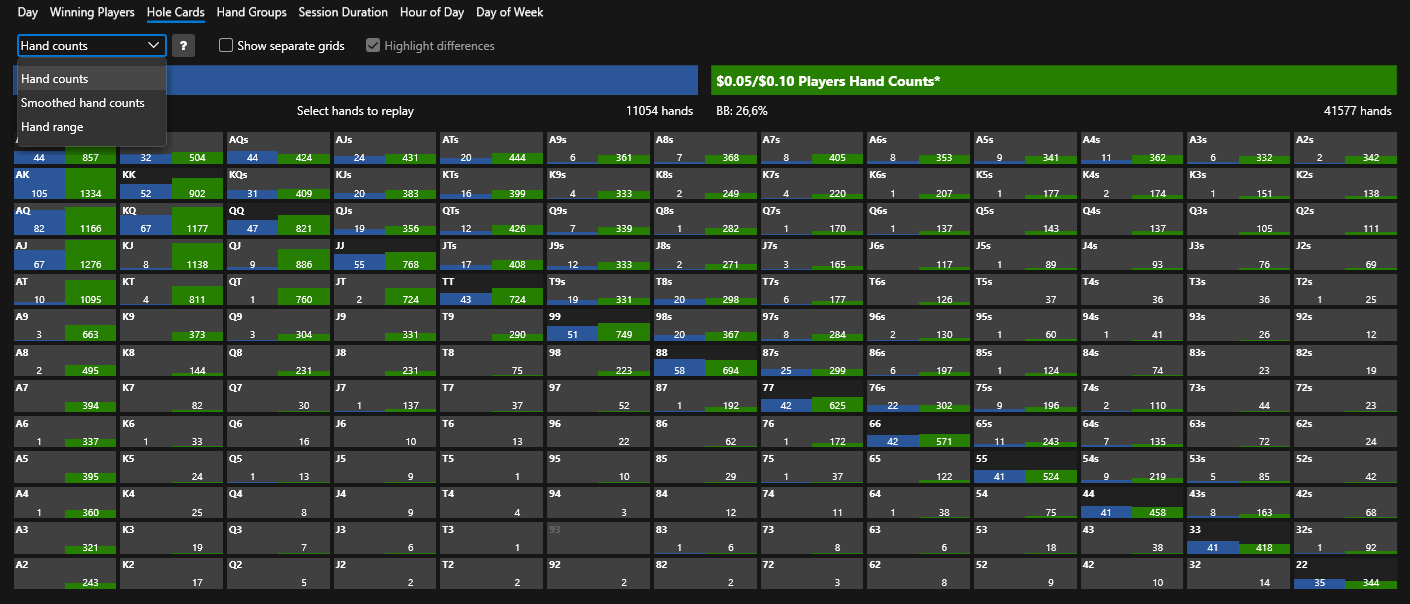
Hole Cards Tab
The Hole Card tab is only used for Preflop Stats.
Blue Cards are your hands and the Green Cards are the Winning Players hands.
There are three options in this view:
- Hand counts
- Smoothed hands counts
- Hand range
Click the "?" icon to see a description of each option.
Use the "Show separate grids" option to see the results in two grids if you prefer.
In the "Hand range" view the "Highlight differences" option is also avaliable. This will highlight the biggest differences between "Hero" range and the "Winning players" range by blacking out the hands where there are no significant differences.
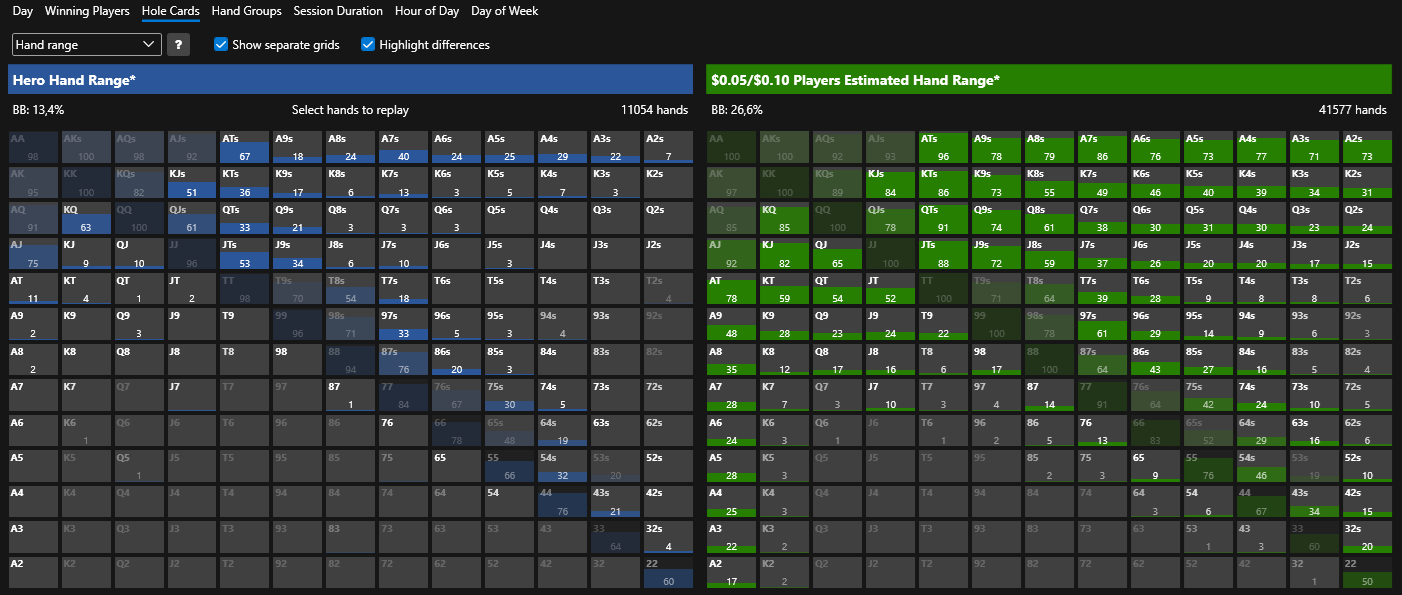
Note: The hand counts at the right top of the grids represent the total number of hands found for the specific spot/leak we are currently analyzing.
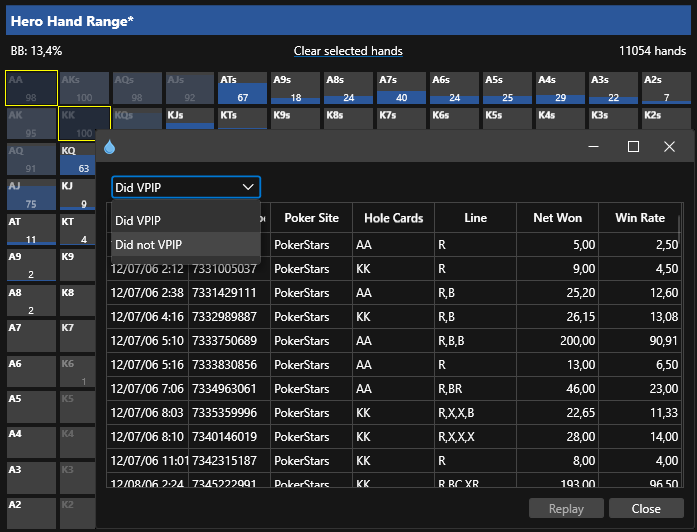
Replay Hands
Click any hole card, or select multiple hole cards, in the Hero Hole Card Heat Map and you can replay hands in the Holdem Manager 3 Hand Replayer.
Use the dropdown menu to select what hands to view from the avaliable options for the leak (In the screenshot below if hero did VPIP or not the selected hole cards).
Hand groups
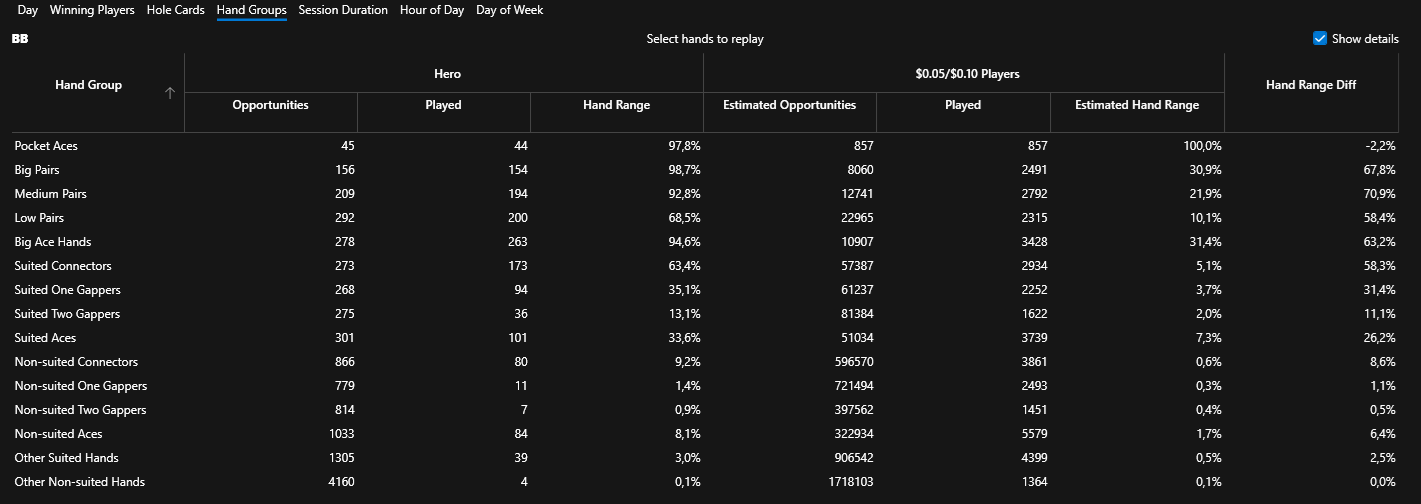
The Hand groups tab will show the results for specific hand groups representing similar type of hands. This is usefull to determine if a particular set of type of hands is working well or not in our gameplan.
Using the "Show details" option will add the Opportunities and Played columns to the view.
Session duration
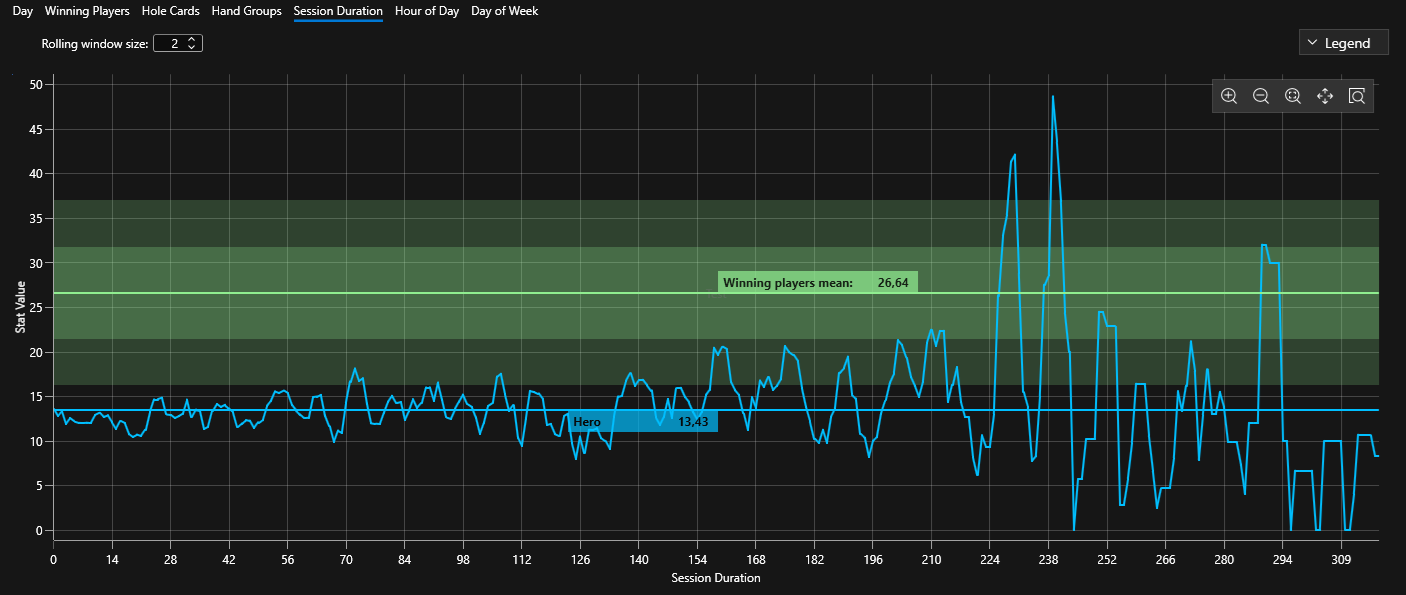
This view helps in determining if there is a specific amount of time where our results start to take a big dip in performance.
Do you feel you get tired after a certain amount of time playing? This view will help you find the limits and schedule sessions that are just long enough to prevent reaching the breaking point in performance.
Hour of day
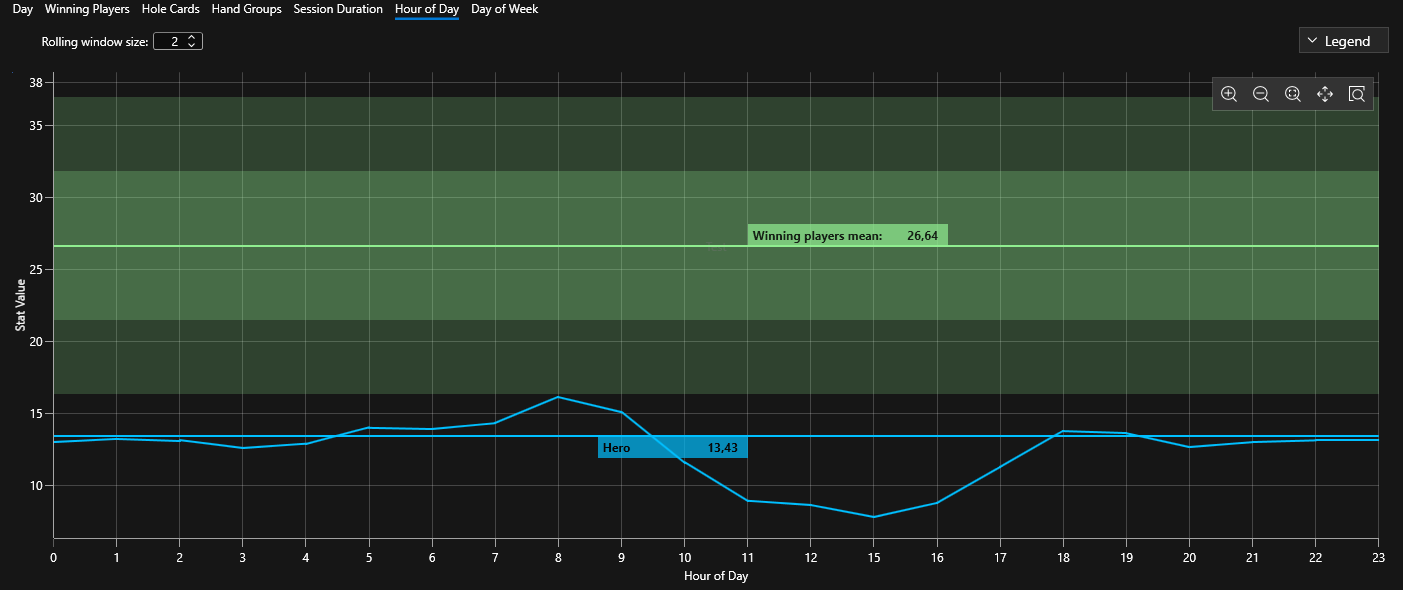
Similar to the above view, the hour of day helps us understand if there is a specific hour of the day where we are more profitable or maybe if the field gets tougher and that is affecting our results.
Notice the big dip in the hero results between 10h and 17h. This hints that the filed is tougher in those hours.
Day of week
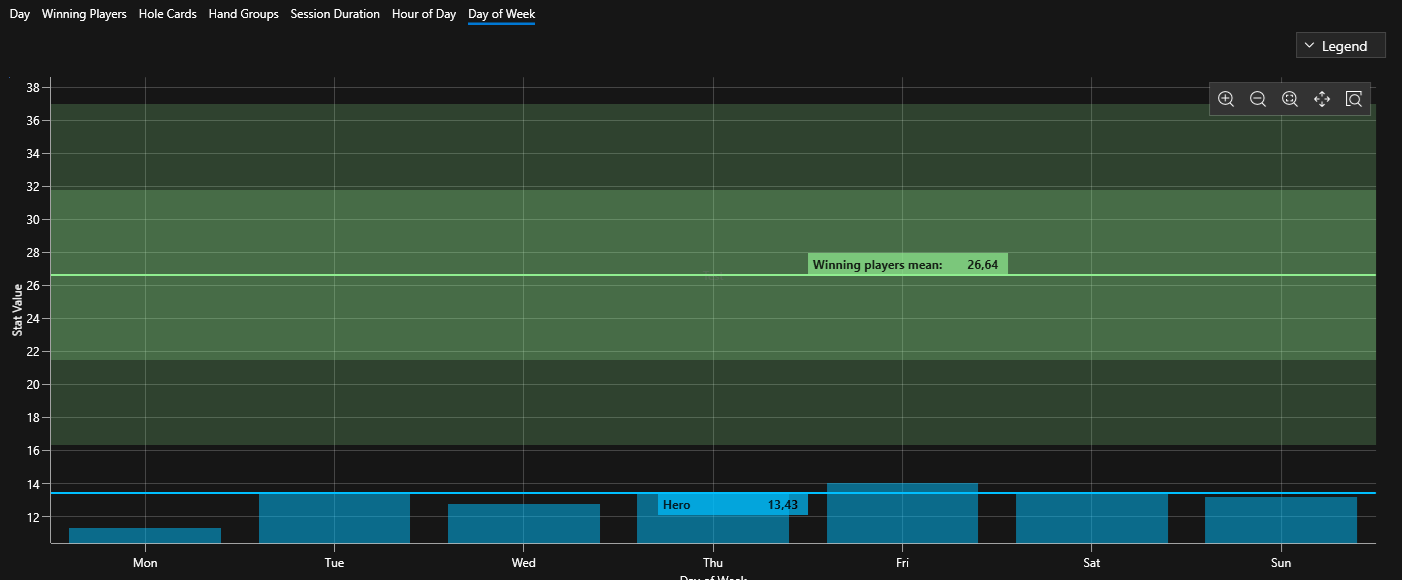
Similar to the last two views, this one analysis play by day of the week.
If there is a day where the results are far worse than other there is most likely something affecting your performance. This can be related to the field being tougher in a specific day or maybe something in our routine is affecting the performance in that specific day.