
Situational Views break down the most common poker situations researched and provide a graphical representation of the data. This makes the data easier to read than a standard report and less filters can be used to achieve the exact data you are looking for.

- All Report Filters can be used in Situational Views. Report Filters (FAQ)
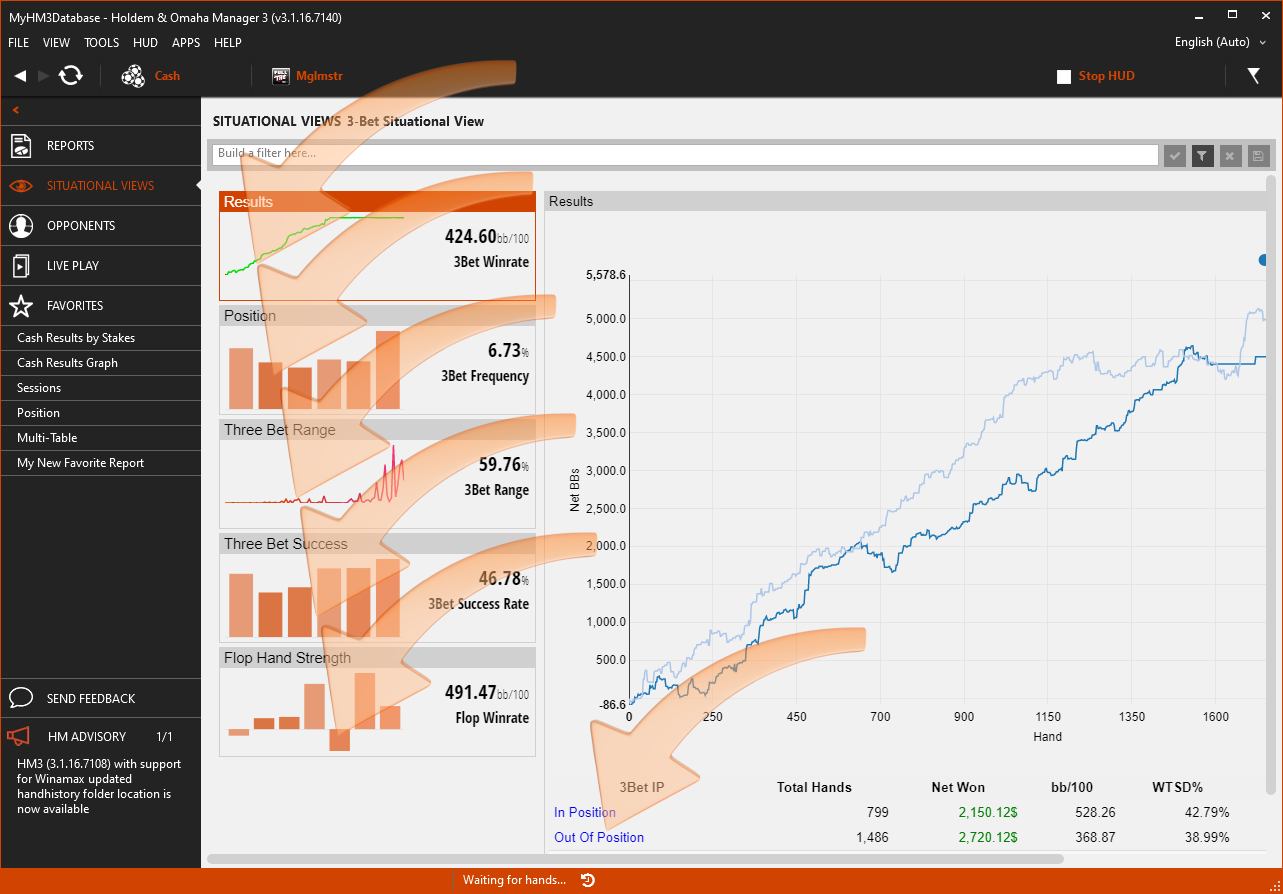
- All Situational Views have data points that can be clicked to view more information. (See arrows below)
Situational Views:
- 3-Bet Situational View
- C-Bet Situational View
- River Play Situational View
- Tournament All-In Situational View
3-Bet Situational View
The 3-Bet Situational View breaks down the most common 3-Bet poker situations researched and provides a graphical representation of the data. This makes the data easier to read than a standard report and less filters can be used to achieve the exact data you are looking for.
- Click the numbered list below the screenshot to view more detailed information.
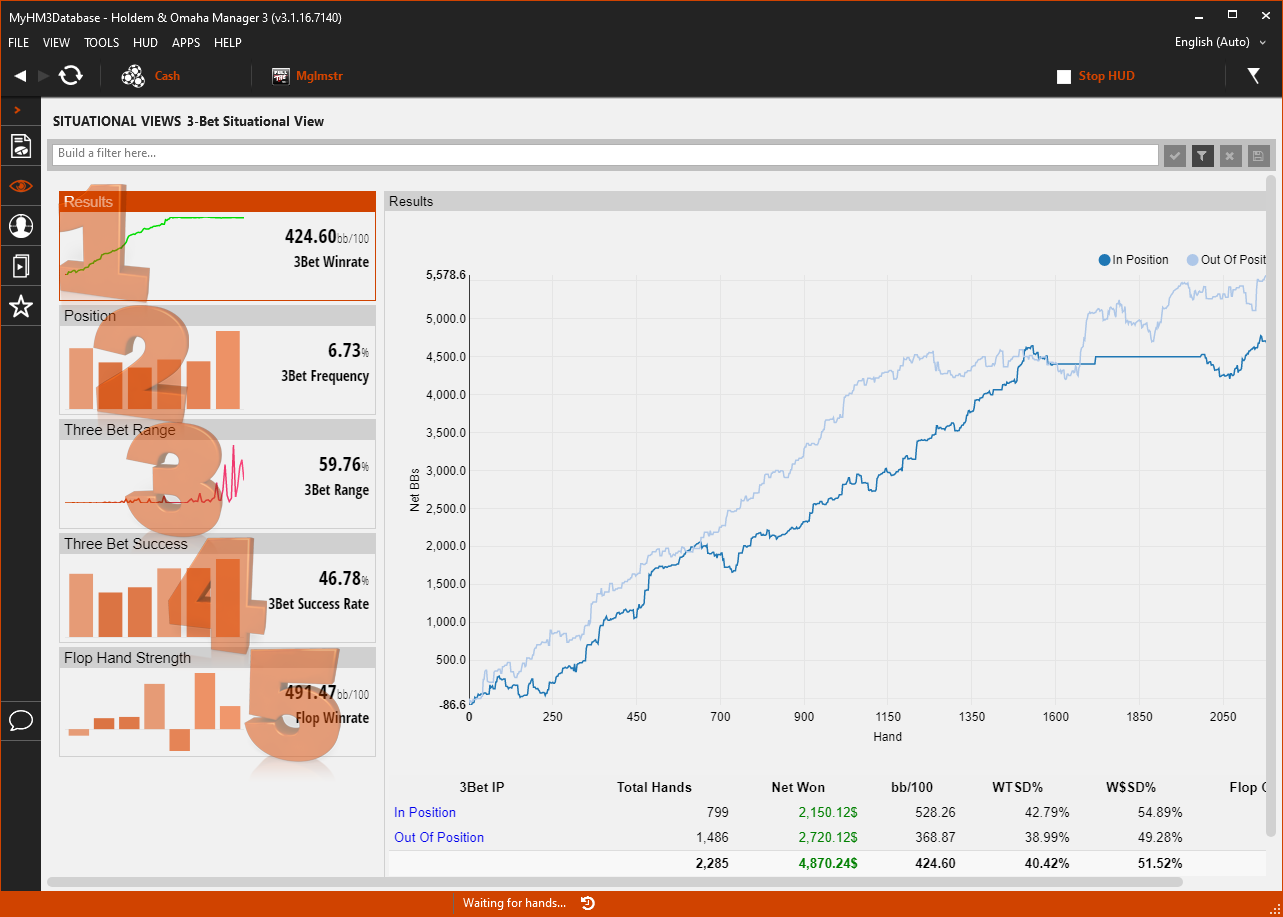
1. Results
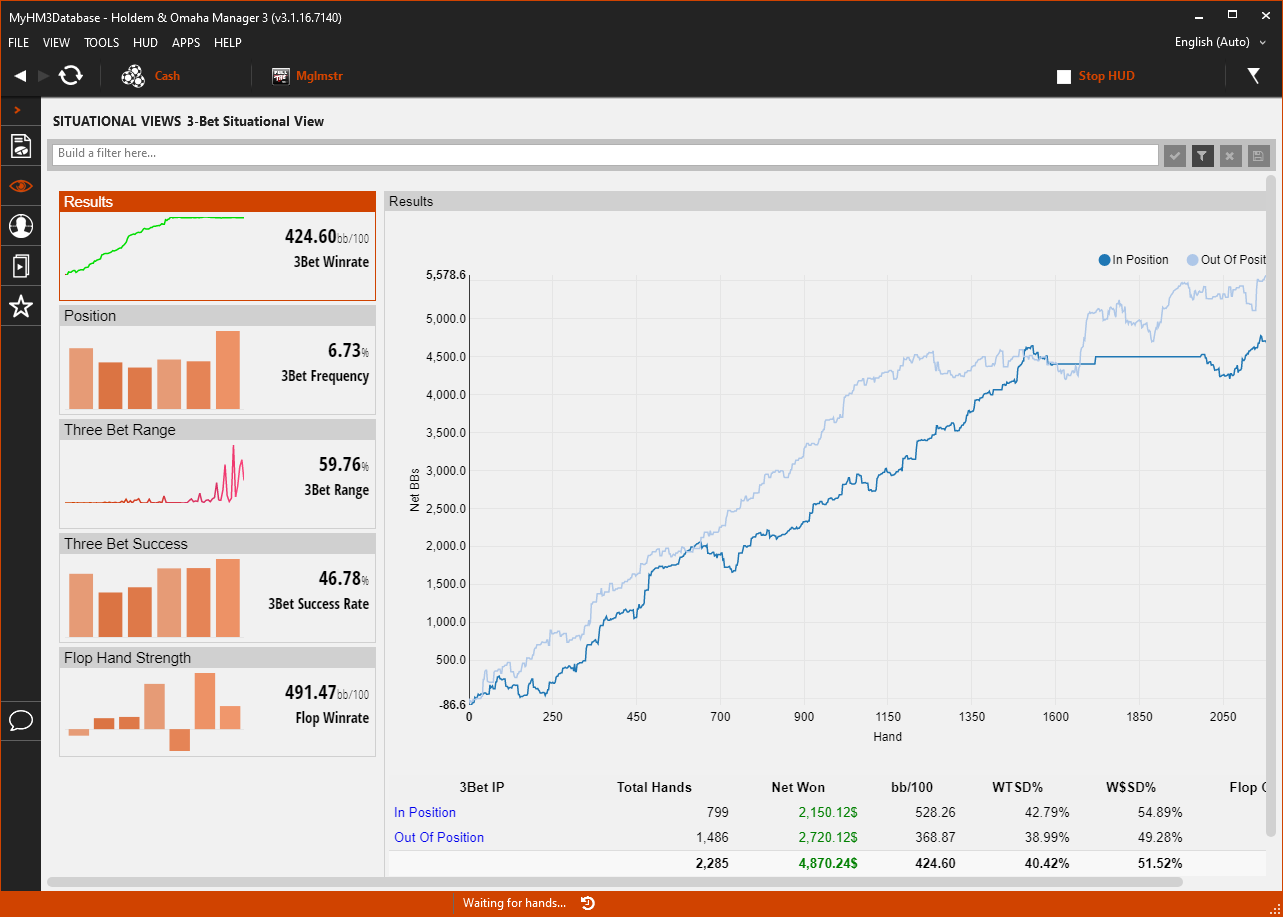
- The Results Tile on the left displays your overall 3-Bet Winrate.
- The main view displays 3-Bet results based on when you were In Position & Out of Position.
- Click In Position or Out of Position at the bottom to load the Holdem Manager 3 Hand View so you can replay and mark hands for review.
2. Position
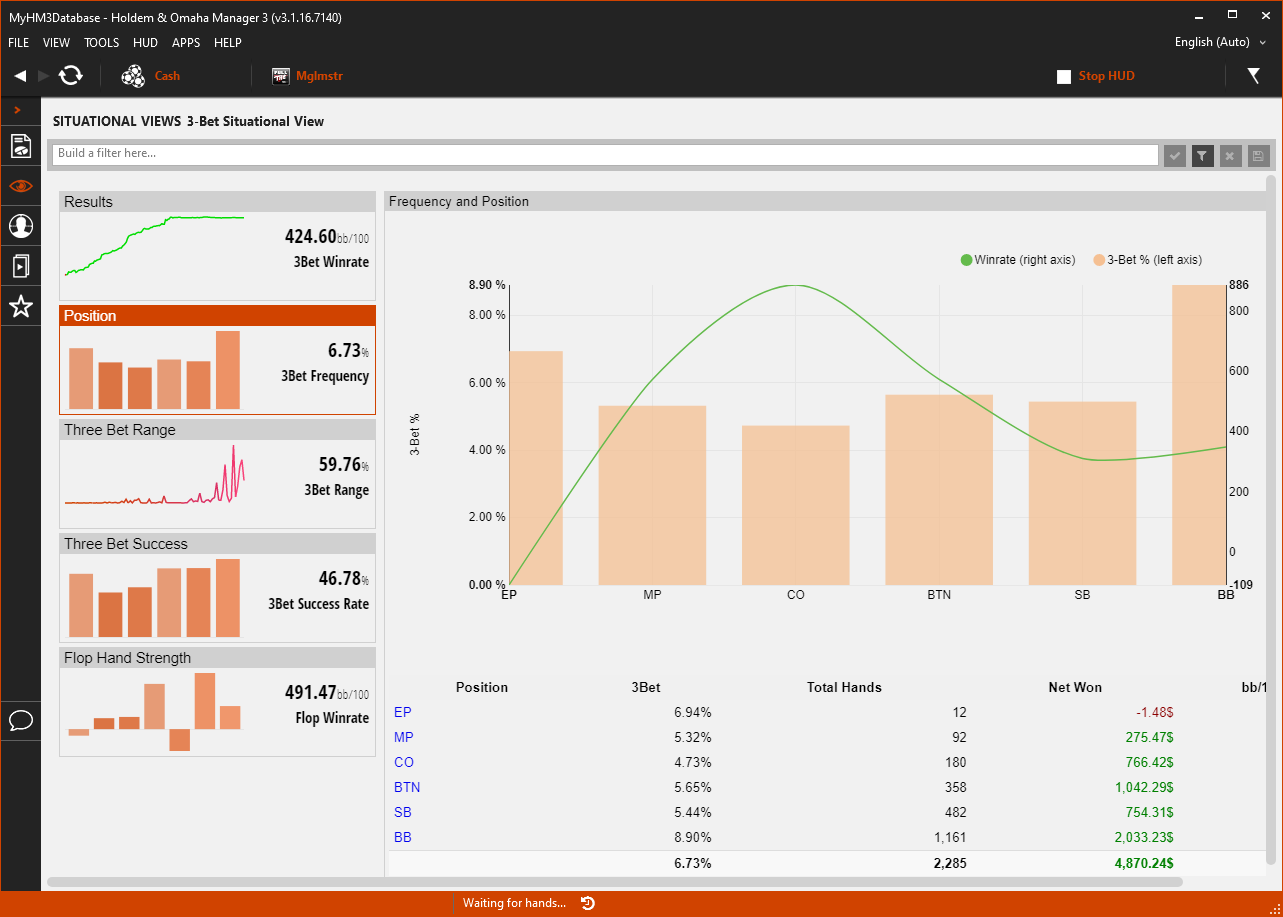
- The Position Tile on the left displays your overall 3-Bet Frequency.
- The main view displays 3-Bet results based on Position.
- Orange Bars = 3-Bet % & Green Line = Winrate
- In the example above the player 3-Bets the most from the Big Blind (BB) and they win the most 3-Betting from the Cutoff (CO).
- Click any of the positions (EP, MP, CO, BTN, SB, BB) to load the Holdem Manager 3 Hand View so you can replay and mark hands for review.
3. Three Bet Range
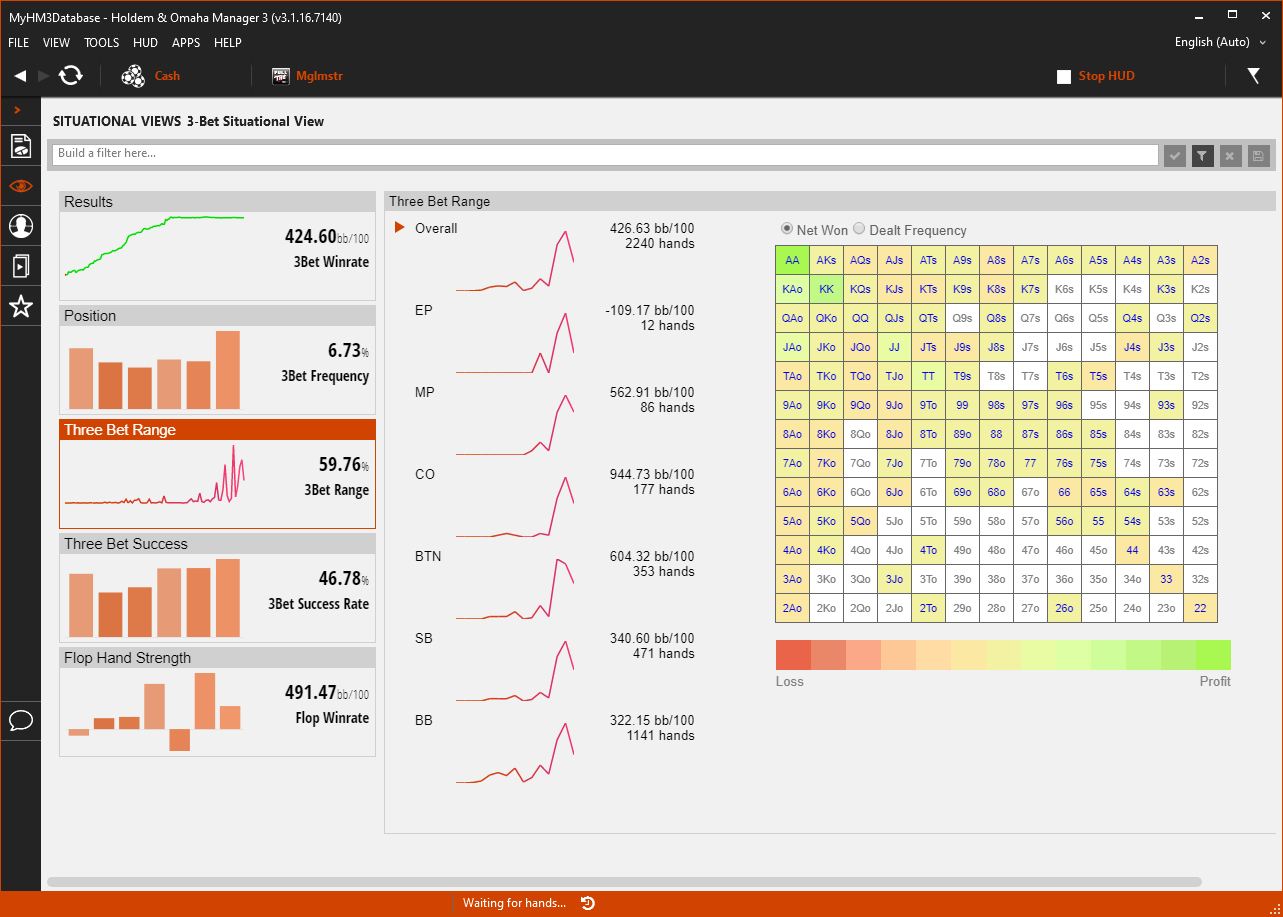
- The 3-Bet Range Tile on the left displays your overall hand range when 3-Betting.
- The main view displays 3-Bet results based Net Won & Dealt Frequency.
- Click any of the positions (EP, MP, CO, BTN, SB, BB) to filter the Hole Card Heat Map by position.
- Click any hand in the Heat Map to load the Holdem Manager 3 Hand View so you can replay and mark hands for review.
4. Three Bet Success
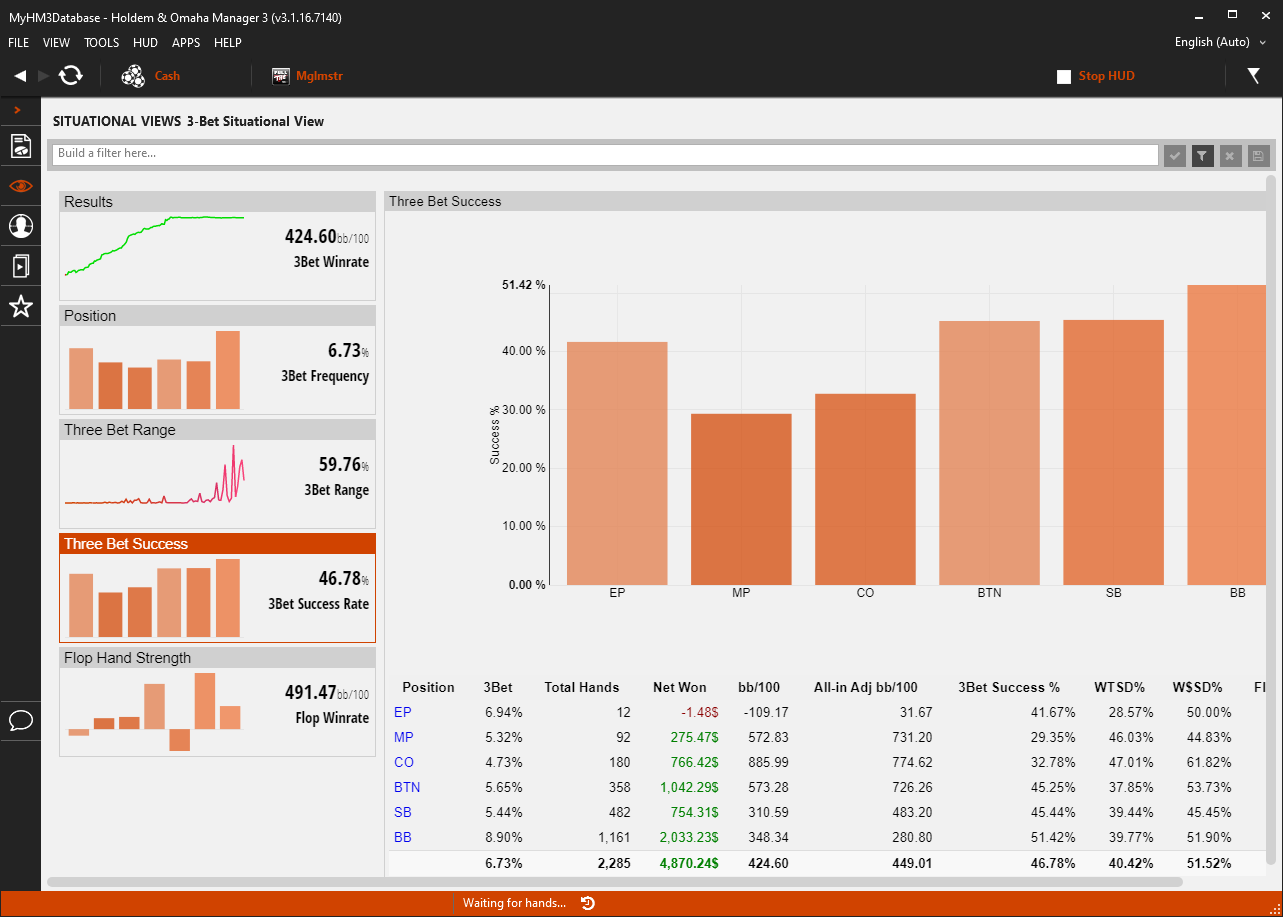
- The Three Bet Success Tile on the left displays your overall 3-Bet Success when 3-Betting.
- The main view displays 3-Bet Success Results based on Position.
- Click any of the positions (EP, MP, CO, BTN, SB, BB) to load the Holdem Manager 3 Hand View so you can replay and mark hands for review.
5. Flop Hand Strength
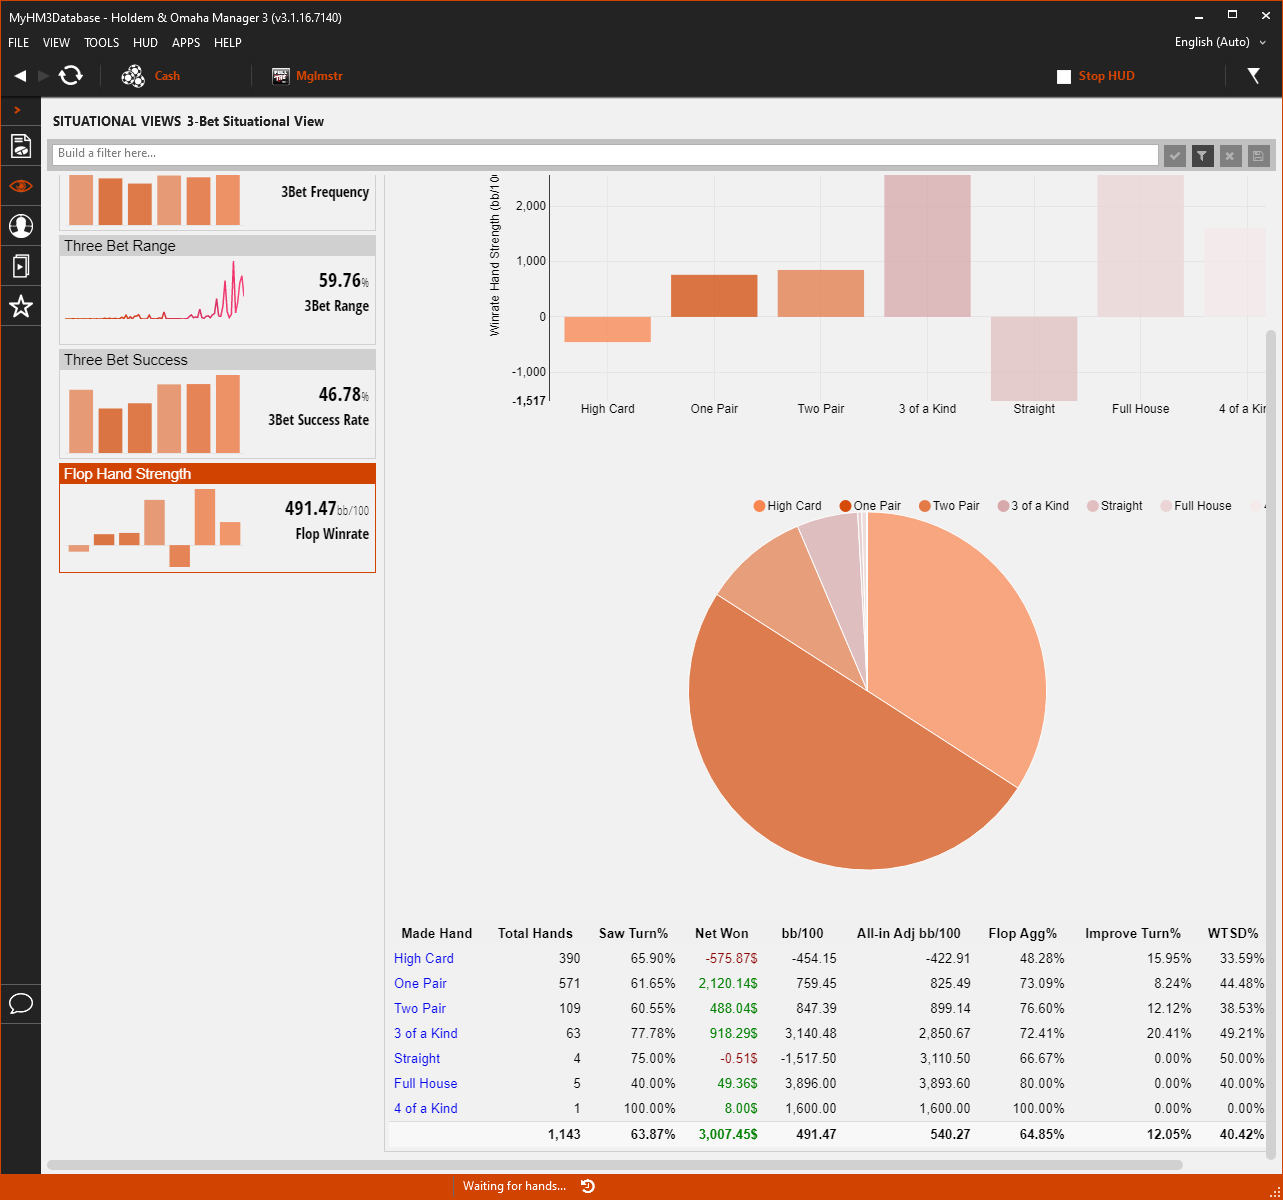
- The Flop Hand Strength Tile on the left displays your overall Flop Winrate.
- The main view displays your Win Rate based on your Flop Hand Strength.
- Hover over any hand strength at the top to view exact Big Blind/100 Earnings.
- Hover over the Pie Chart to see how often you have the corresponding made hand on the Flop.
- Click a Made Hand at the bottom to load the Holdem Manager 3 Hand View so you can replay and mark hands for review.
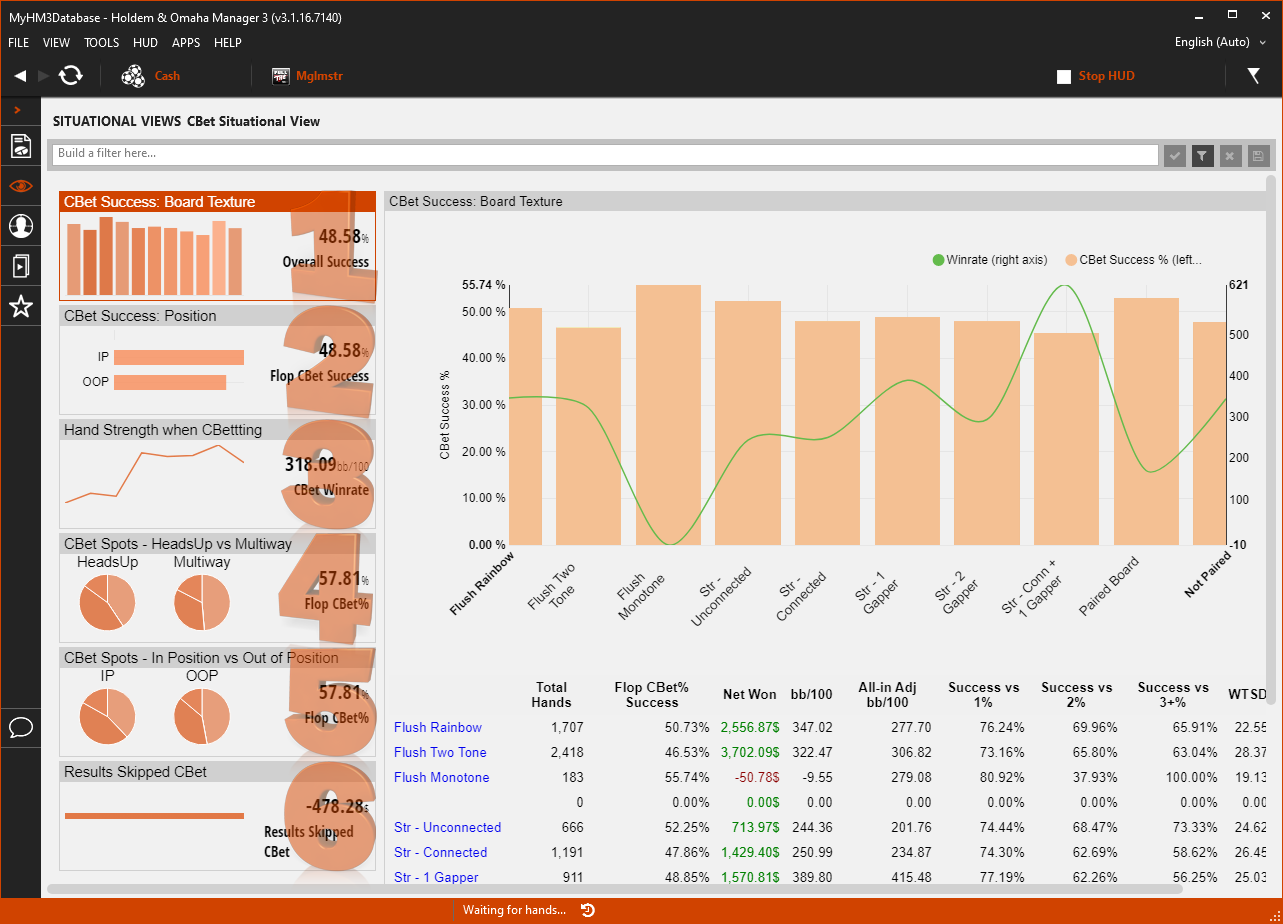
C-Bet Situational View
The CBet Situational View breaks down the most common Continuation Bet poker situations researched and provides a graphical representation of the data. This makes the data easier to read than a standard report and less filters can be used to view the exact data you are looking for.
- Click the numbered list below the screenshot to view more detailed information.
- CBet Success: Board Texture
- CBet Success: Position
- Hand Strength when CBetting
- CBet Spots - HeadsUp vs Multiway
- CBet Spots - In Position vs Out of Position
- Results: Skipped CBet
1. CBet Success: Board Texture
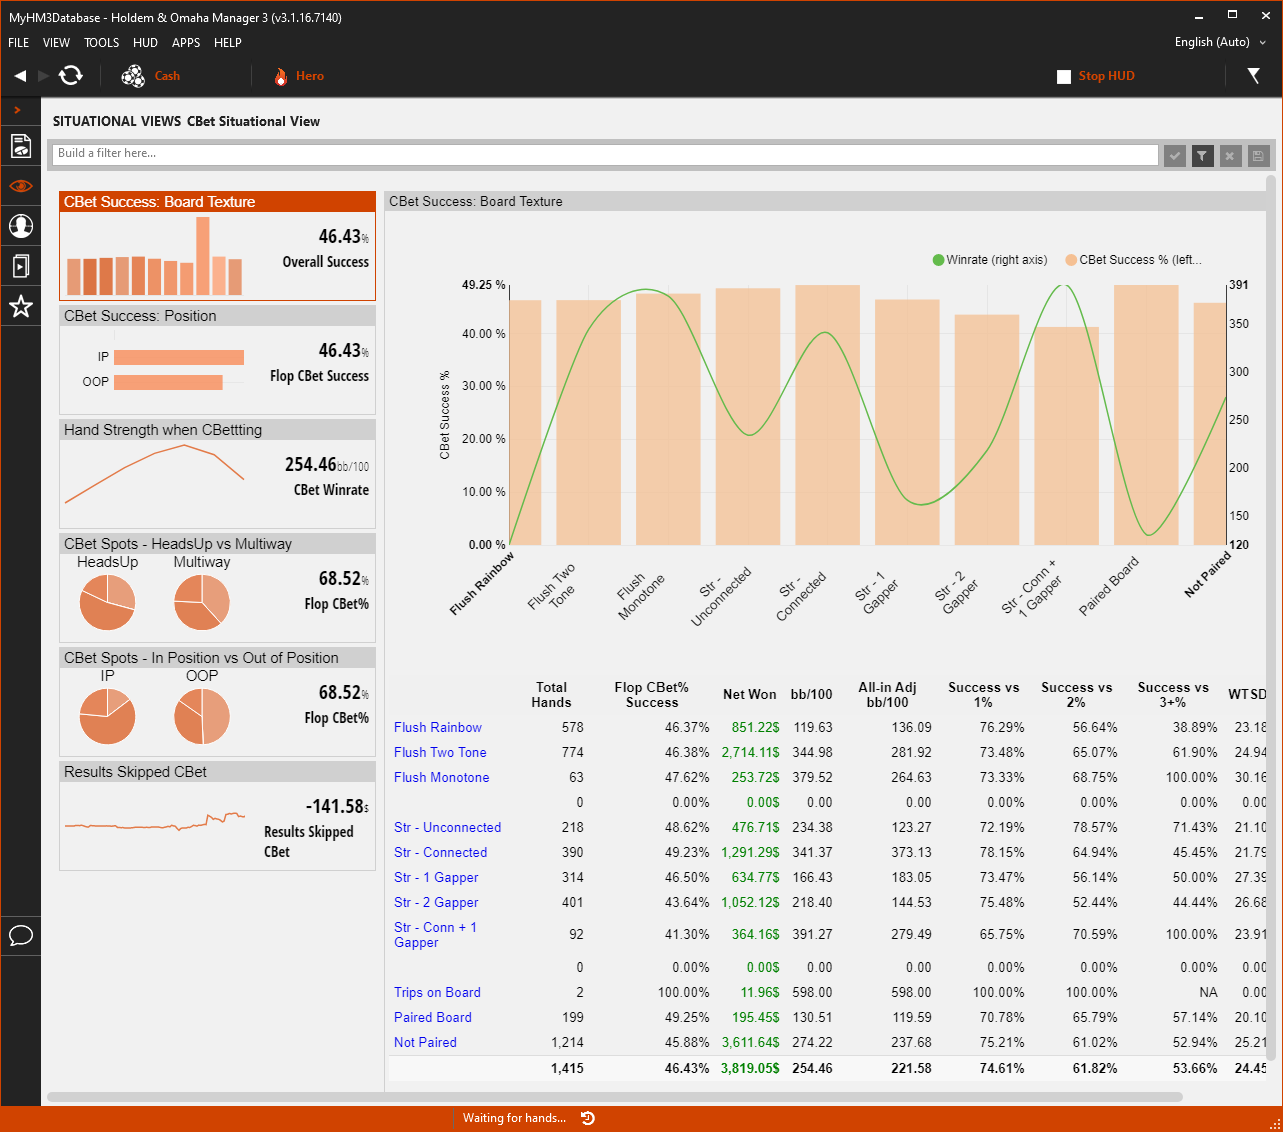
- The CBet Success: Board Texture Tile on the left displays your overall Flop Continuation Bet Success Rate.
- The main view displays CBet Success vs Flop Board Texture.
- Green Line = Winrate vs Orange Bars = CBet Success % based on the board texture.
- The bottom of the main view lists out all Flop Textures with stats on your CBetting for each Flop Texture. Click any Flop Texture at the bottom to load the Holdem Manager 3 Hand View so you can replay and mark hands for review.
2. CBet Success: Position
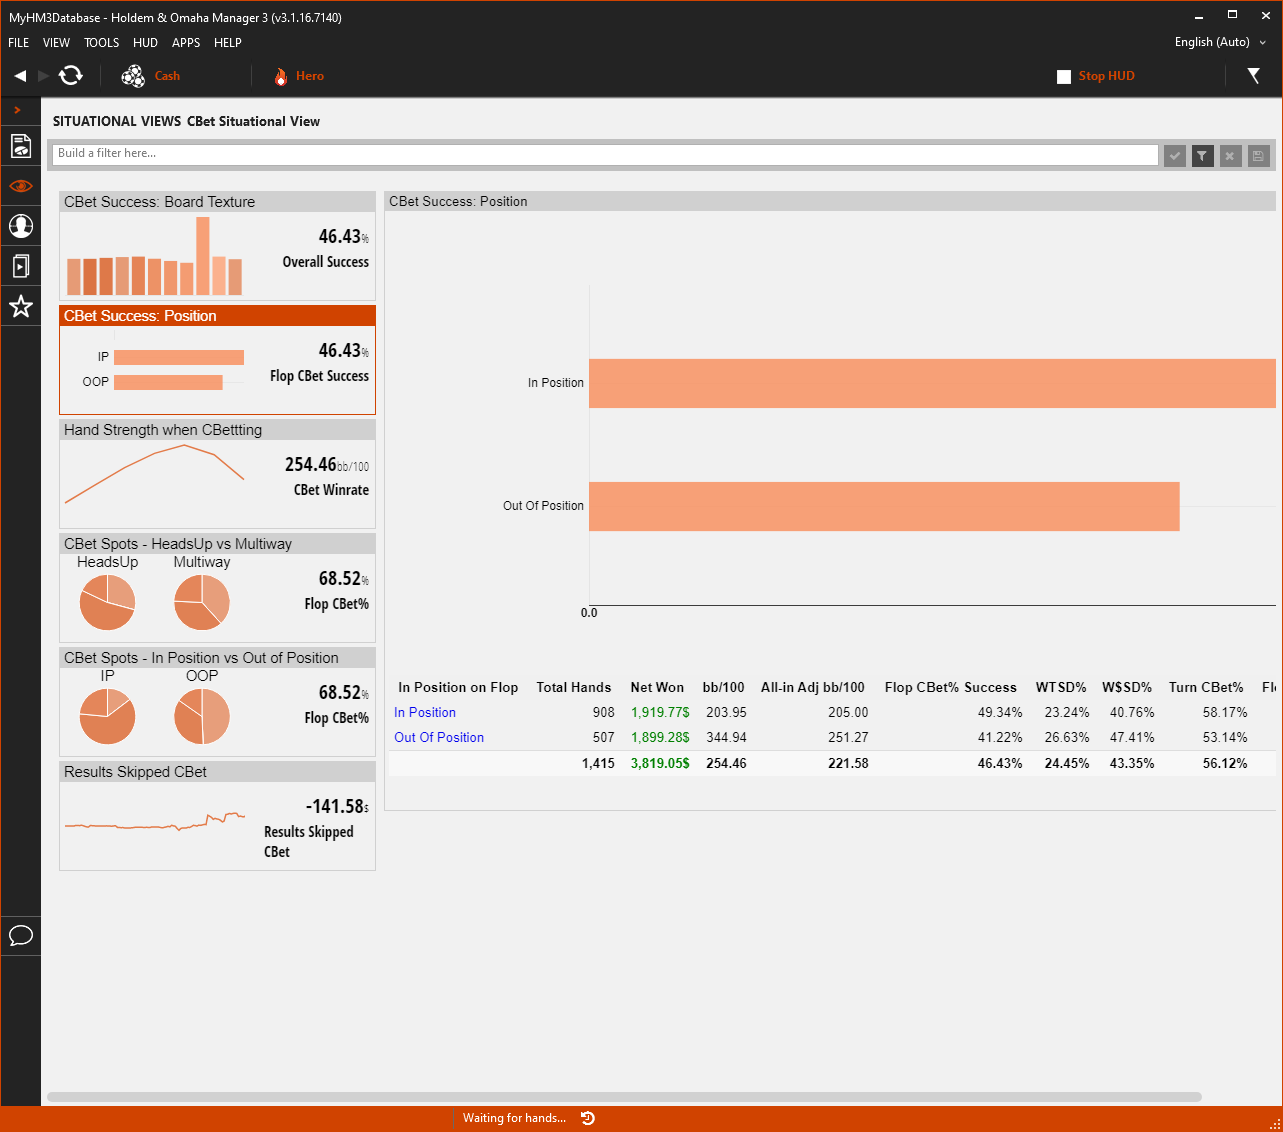
- The CBet Success: Position Tile on the left displays your overall Flop CBet Success Rate.
- The main view displays In Position & Out of Position Success Rate.
- The bottom of the main view lists In Position & Out of Position Flop CBetting stats. Click In Position or Out of Position to load the Holdem Manager 3 Hand View so you can replay and mark hands for review.
3. Hand Strength When CBetting
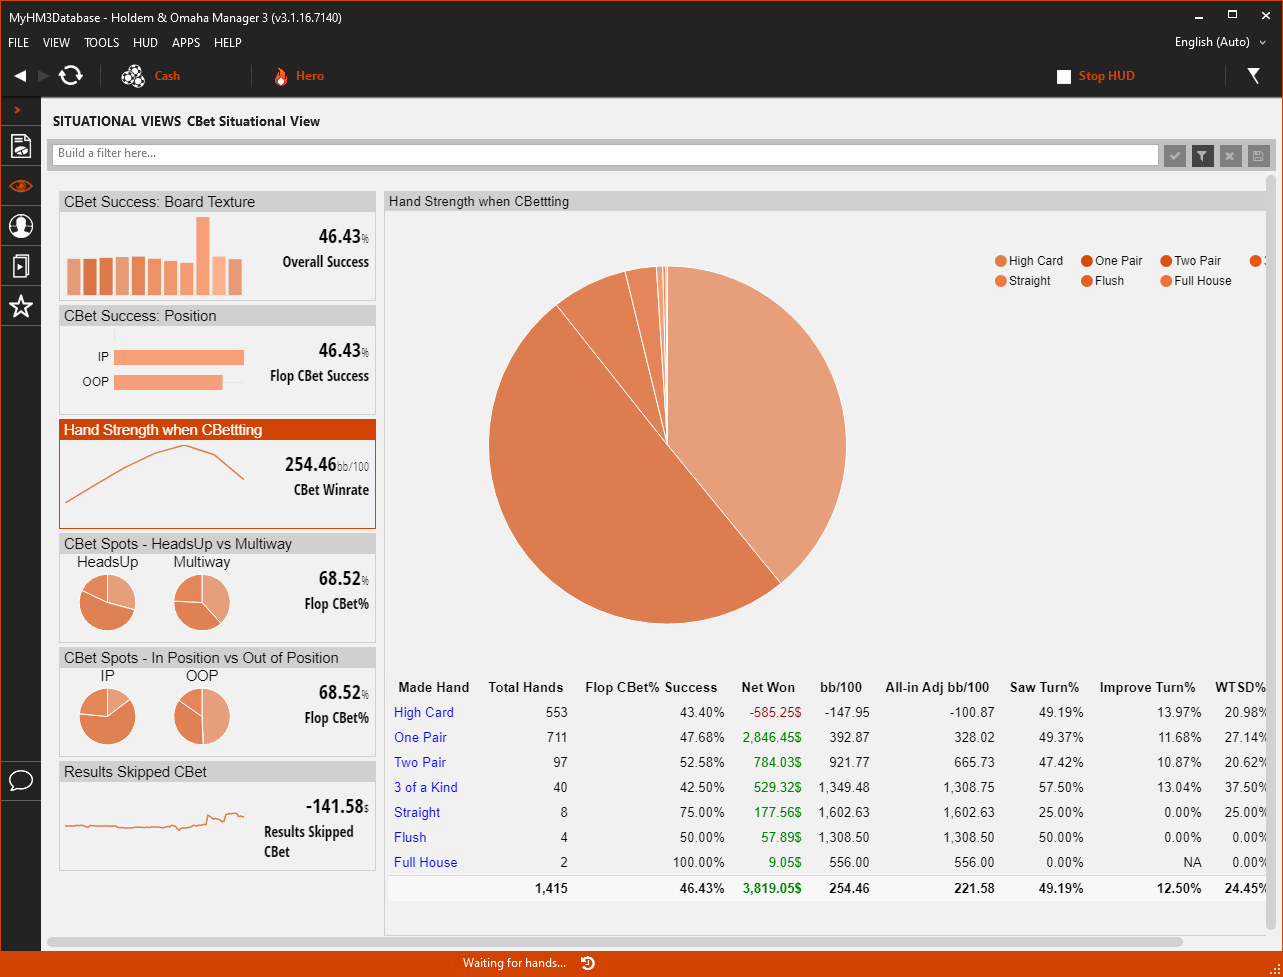
- The Hand Strength when CBetting Tile on the left displays your overall Flop CBet Winrate.
- In the main view, hover your mouse over the Pie Chart to see how often you have the "hovered over" made hand on the flop.
- The bottom of the main view lists out made hands. Click any of the Made Hands to load the Holdem Manager 3 Hand View so you can replay and mark hands for review.
4. CBet Spots - Heads-Up vs Multiway
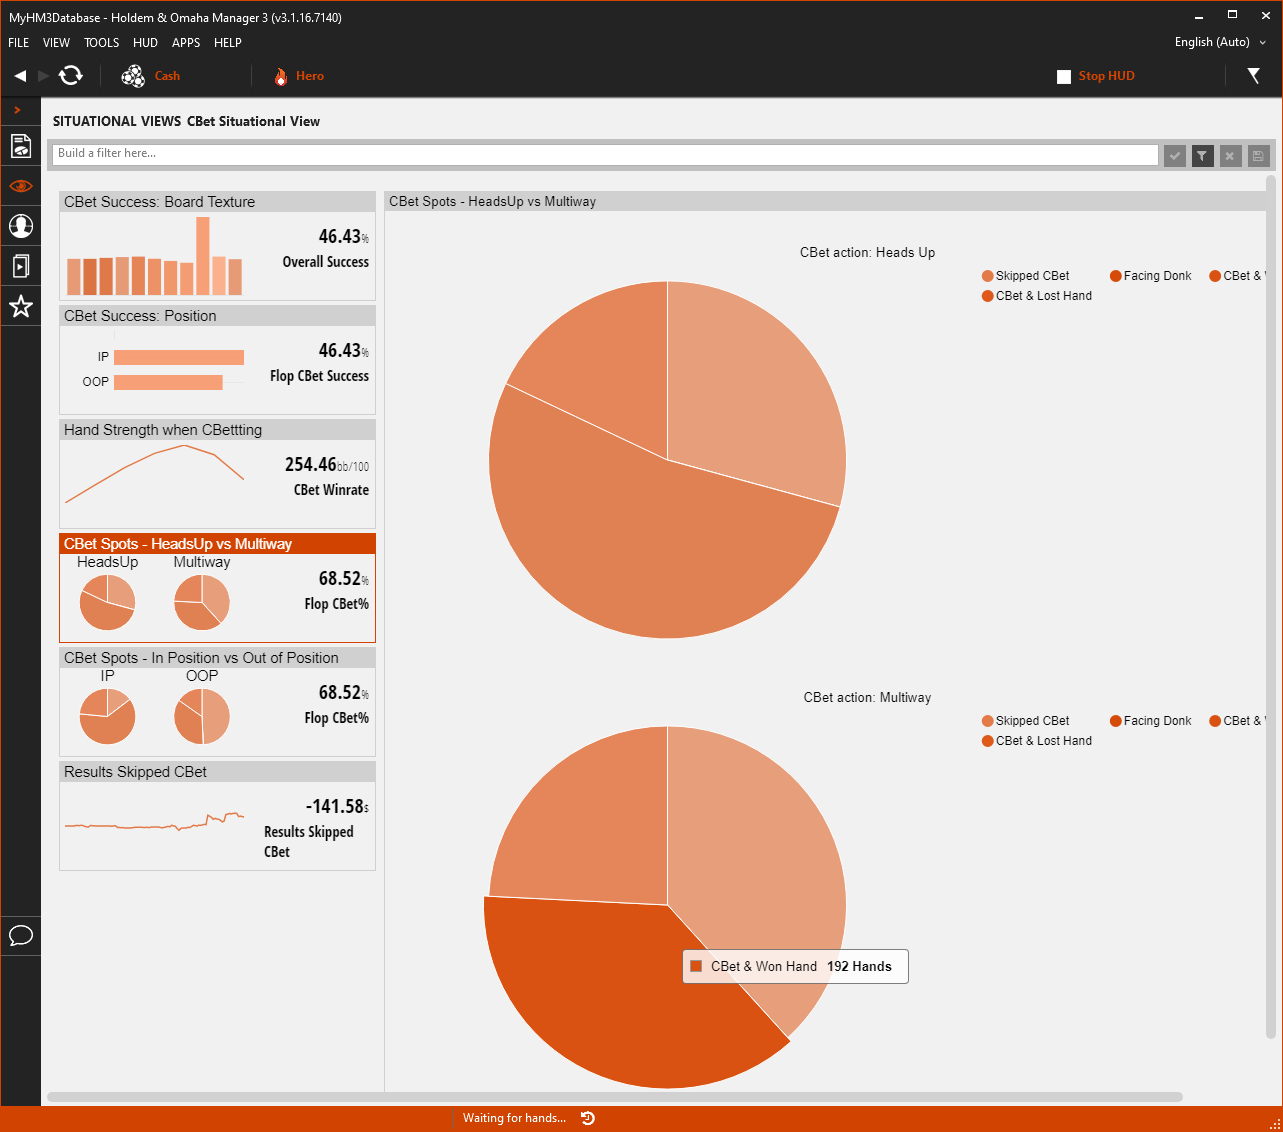
- The CBet Spots - HeadsUp vs Miltiway Tile on the left displays your overall Flop CBet Winrate with the addition of times when you didn't CBet. (Skipped CBet)
- In the main view, hover your mouse over the Pie Charts to see how many times you performed each of the actions in HeadsUp Hands vs Multiway Hands.
- CBet & Lost Hand
- CBet & Won Hand
- Skipped CBet
5. CBet Spots - In Position vs Out of Position
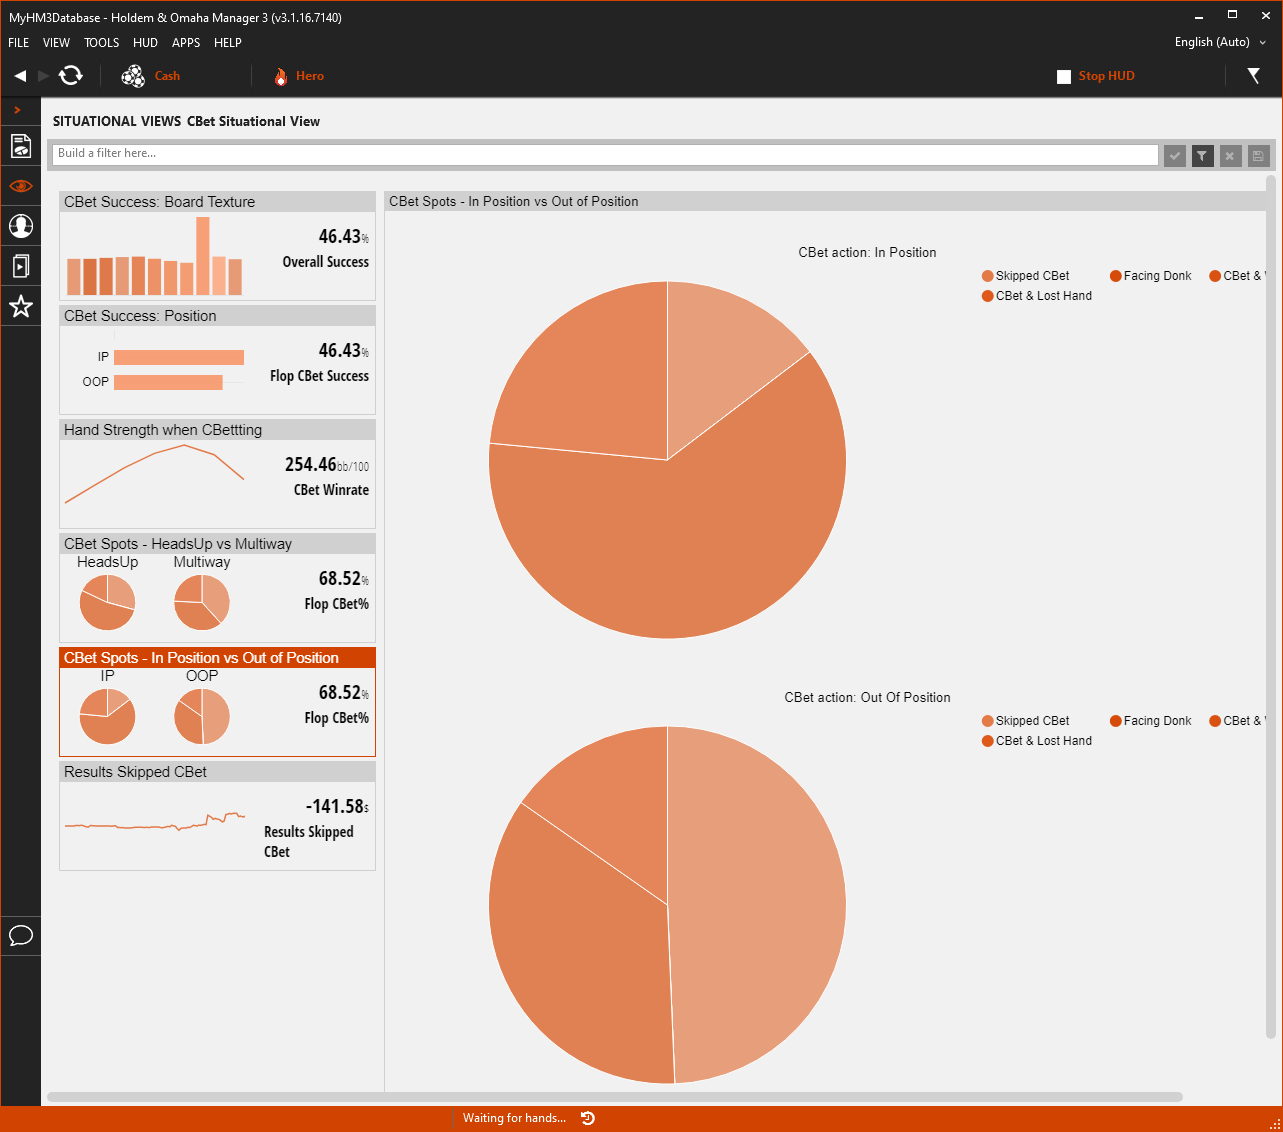
- The CBet Spots - In Position Vs Out of Positon Tile on the left displays your overall Flop CBet Winrate with the addition of times when you didn't CBet. (Skipped CBet)
- In the main view, hover your mouse over the Pie Charts to see how many times you performed each of the actions In Position & Out of Position.
- CBet & Lost Hand
- CBet & Won Hand
- Skipped CBet
6. Results: Skipped CBet
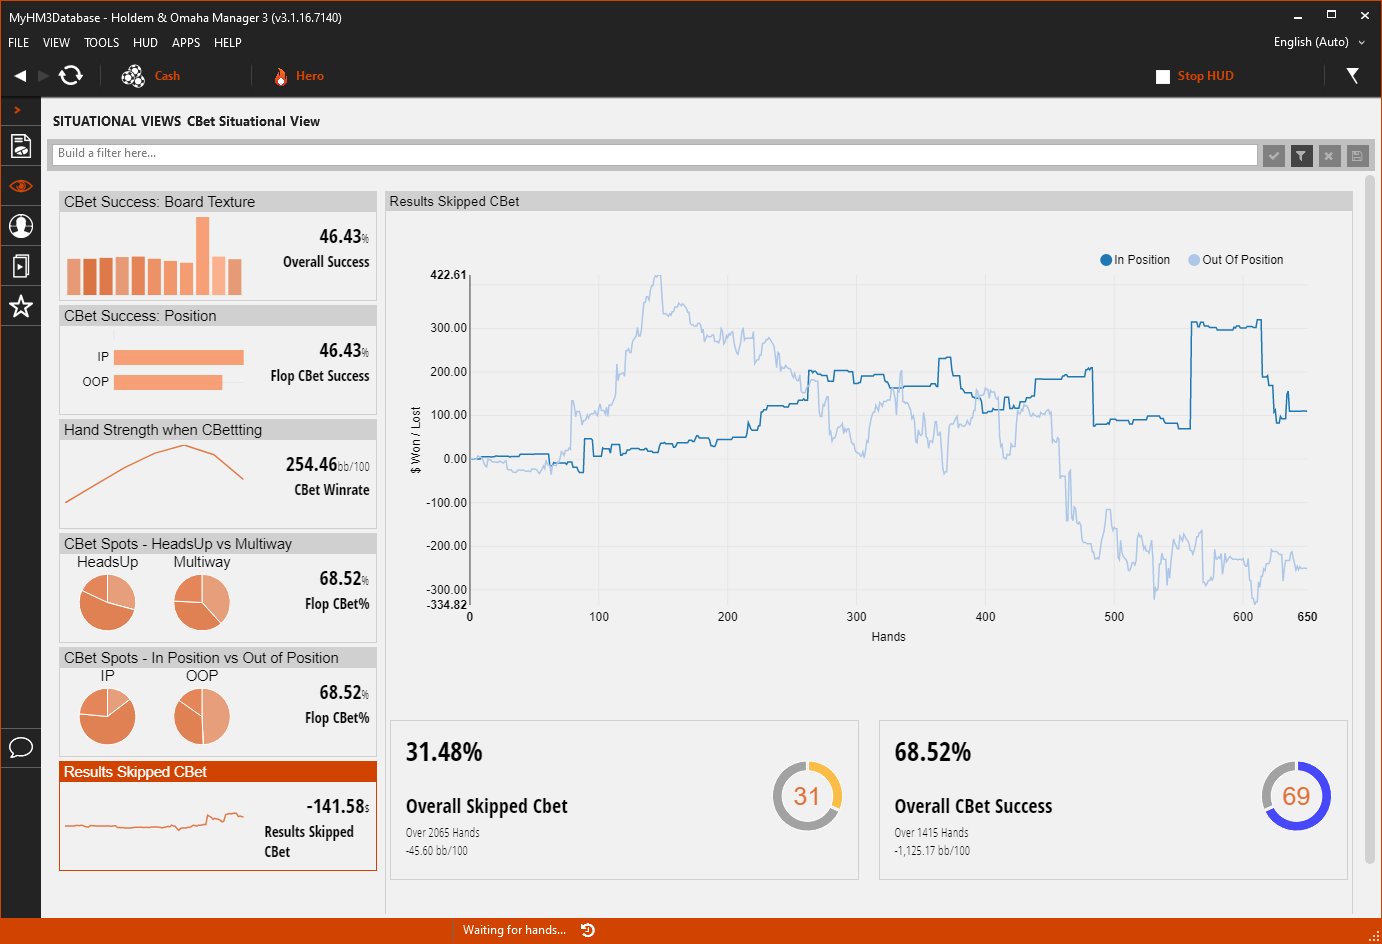
- The Results Skipped CBet Tile on the left displays your overall Skipped CBet Winnings.
- The main view displays your overall all Skipped CBet WinRate broken down by In Position and Out of Position.
- The bottom of the main view displays your Overall Skipped CBet results vs Overall CBet Success results.
River Play Situational View
The River Play Situational View breaks down the most common River Play poker situations researched and provides a graphical representation of the data. This makes the data easier to read than a standard report and less filters can be used to view the exact data you are looking for.
- Click the numbered list below the scre
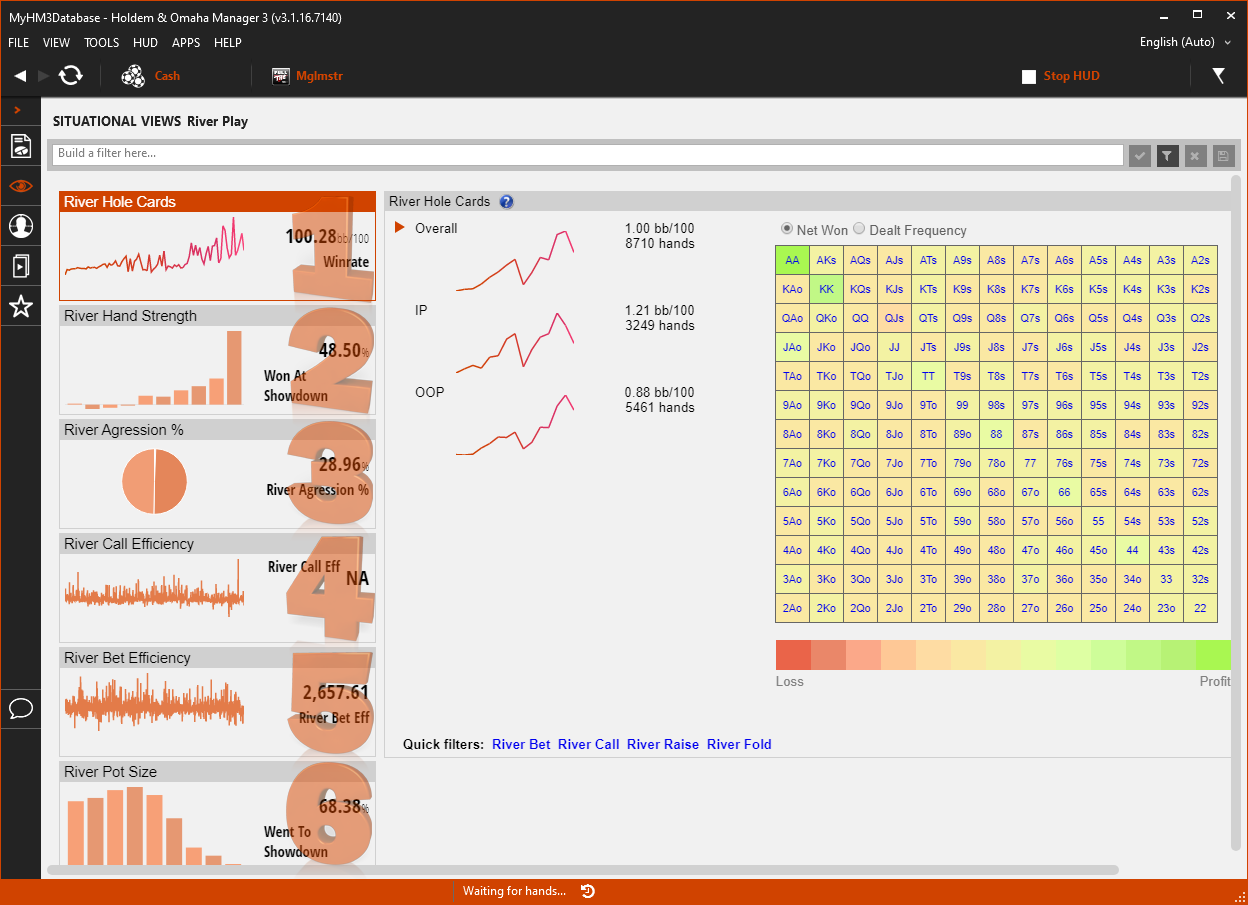 enshot to view more detailed information.
- River Hole Cards
- River Hand Strength
- River Aggression %
- River Call Efficiency
- River Bet Efficiency
- River Pot Size
1. River Hole Cards
- The "River Hole Cards" Tile on the left displays your overall WinRate when you see the River and are still in the hand.
- The main view displays your Overall, In Position and Out of Position WinRates along with Hand Counts.
- The Heat Map in the main view displays your winnings (Net Won) and how often you are dealt the hand. (Dealt Frequency)
- Use the four Quick Filters at the bottom of the Heat Map to filter for common River Actions:
- River Bet
- River Call
- River Raise
- River Fold
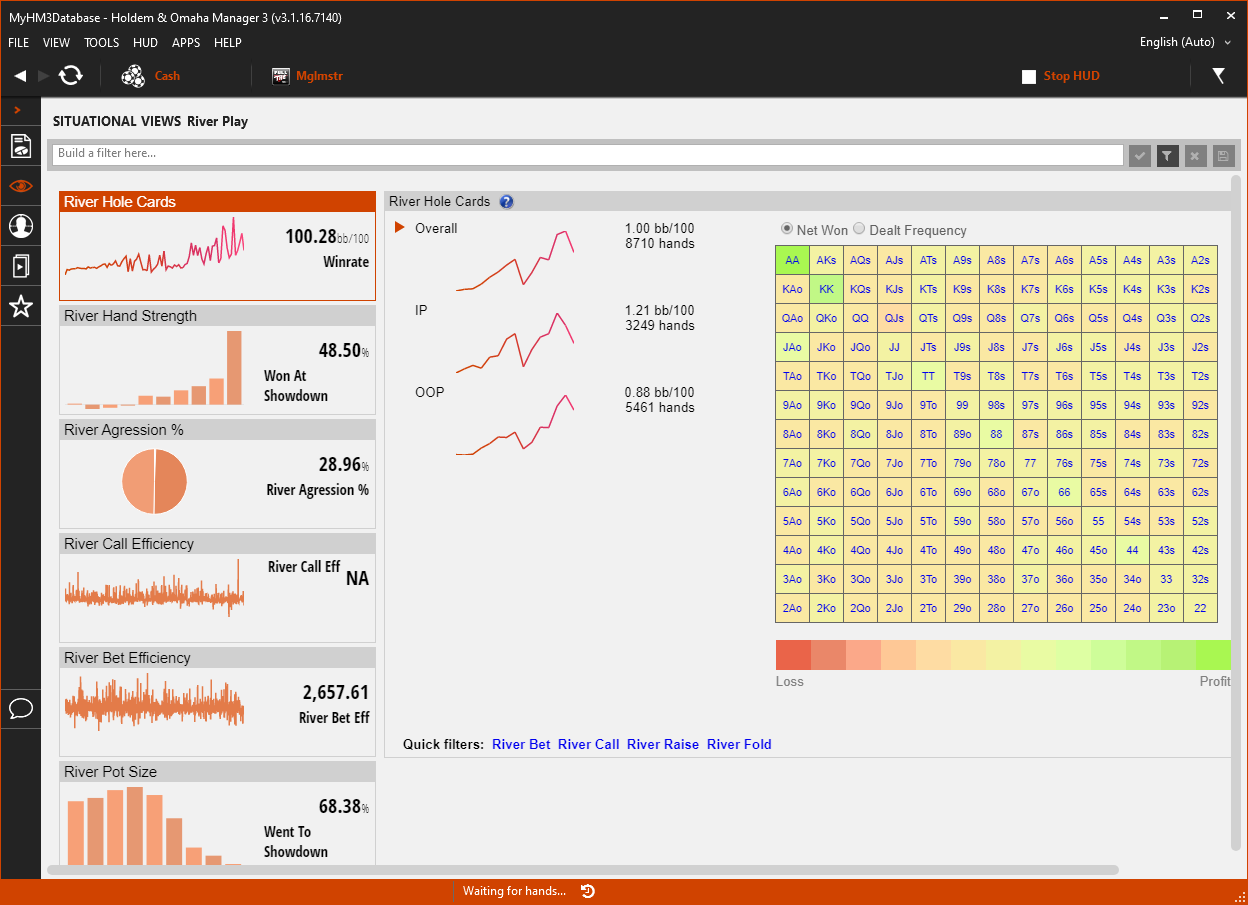
2. River Hand Strength
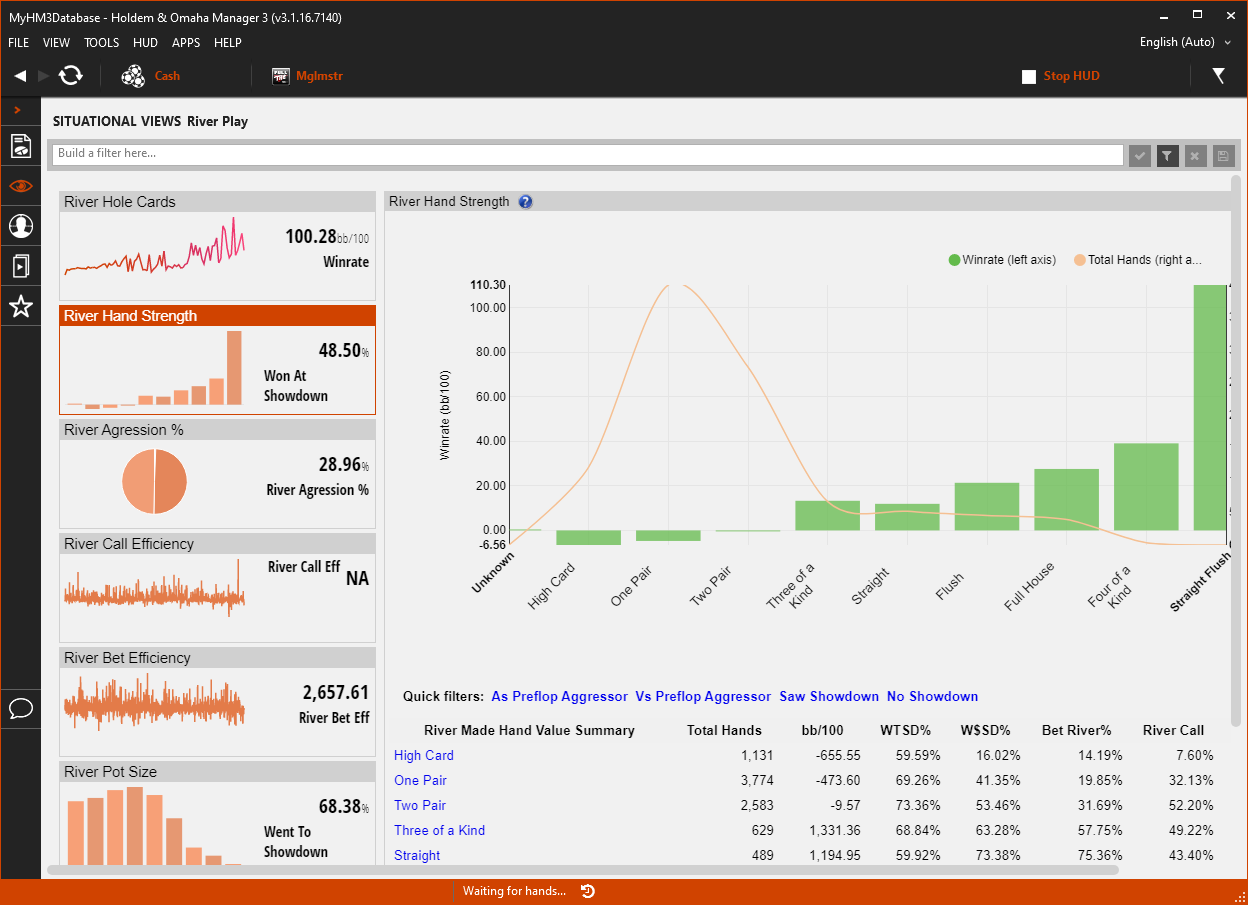
- The "River Hand Strength" Tile on the left displays how often you win at Showdown when seeing the River.
- The main view displays your WinRate (Green) and how often you have the Made Hand (Orange) on the River.
- Use the Quick Filters to update the main view Graph as the:
- Preflop Aggressor
- Vs Preflop Aggressor
- Saw Showdown
- No Showdown
- Click any River Made Hand Value at the bottom to load the Holdem Manager 3 Hand View so you can replay and mark hands for review.
3. River Aggression %
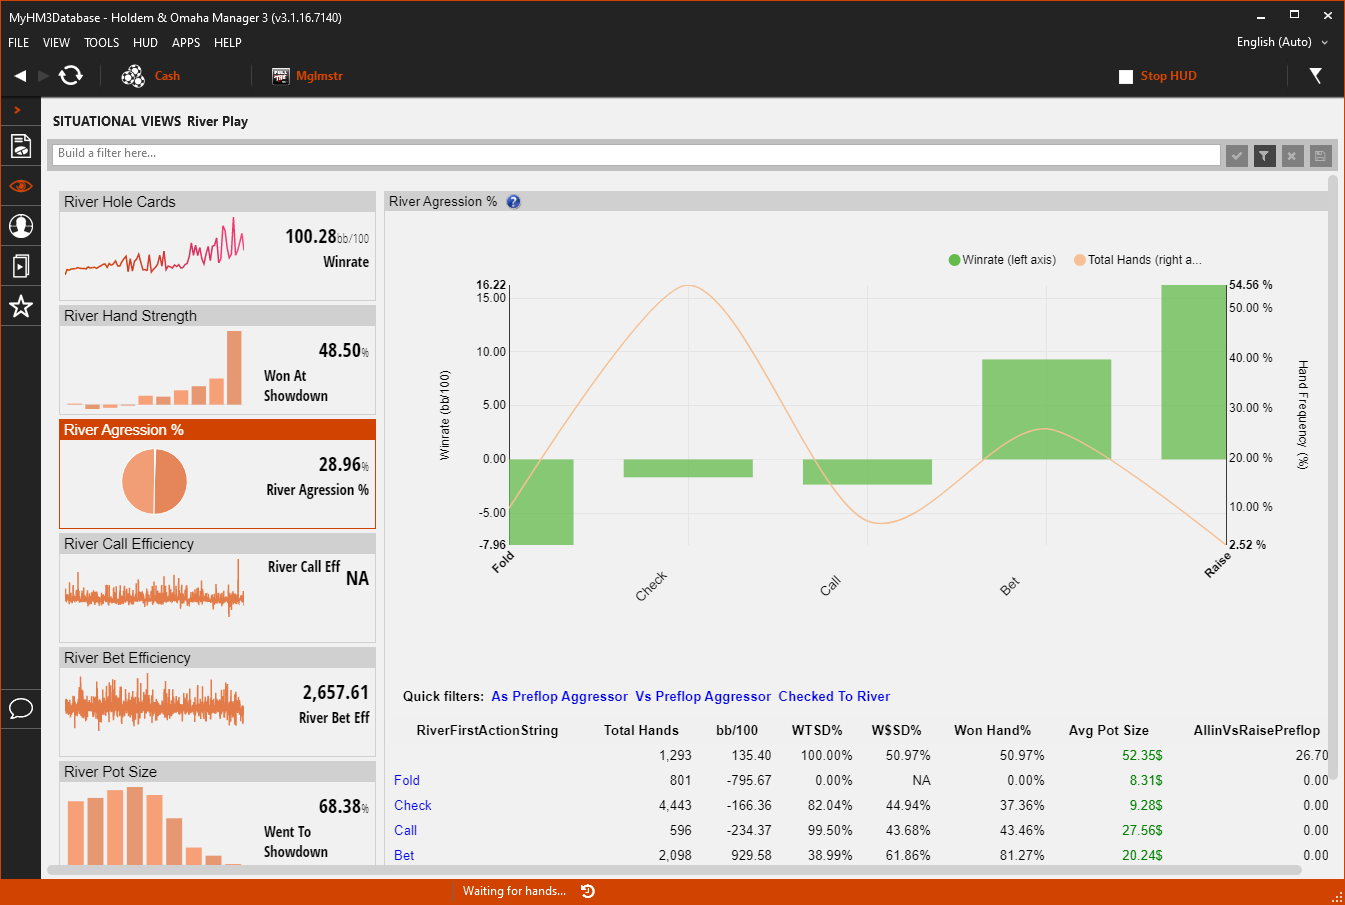
- The "River Aggression %" Tile on the left displays your overall River Aggression % Stat.
- The main view displays your WinRate (Green) and your Total Hands (Orange) when you have performed the action at the bottom of the graph.
- Use the Quick Filters to update the main view Graph as the:
- Preflop Aggressor
- Vs Preflop Aggressor
- Checked To River
- Click any of the River Actions at the bottom to load the Holdem Manager 3 Hand View so you can replay and mark hands for review.
4. River Call Efficiency
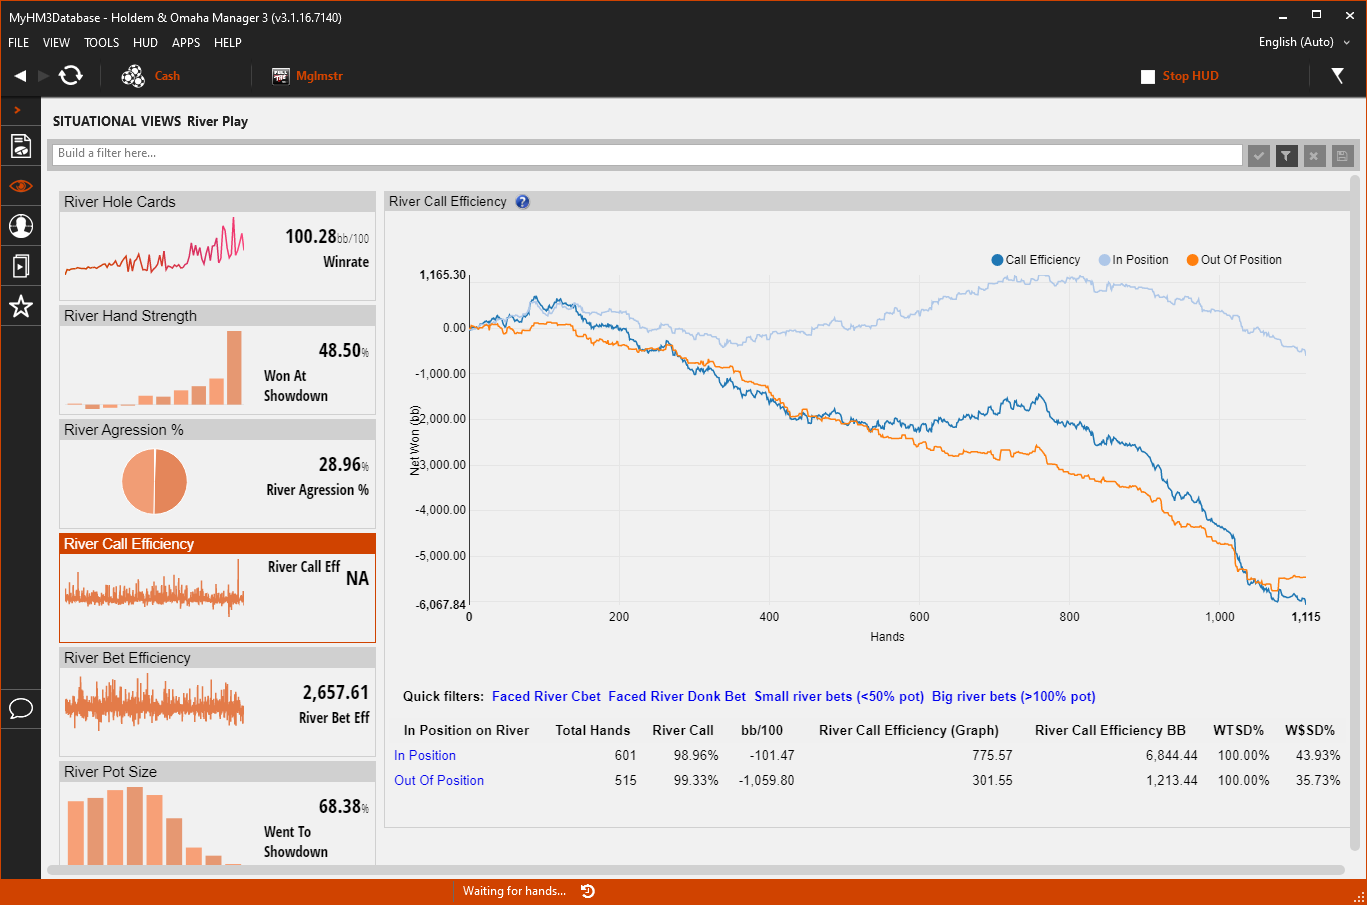
- The "River Call Efficiency" Tile on the left displays your overall River Call Efficiency Stat.
- The main view displays your WinRate in Big Blinds when calling river bets In Position & Out of Position.
- Use the Quick Filters to update the main view Graph when:
- Faced River Bet
- Faced River Donk Bet
- Small River Bets
- Big River Bets
- At the bottom click In Position or Out of Position to load the Holdem Manager 3 Hand View so you can replay and mark hands for review.
5. River Bet Efficiency
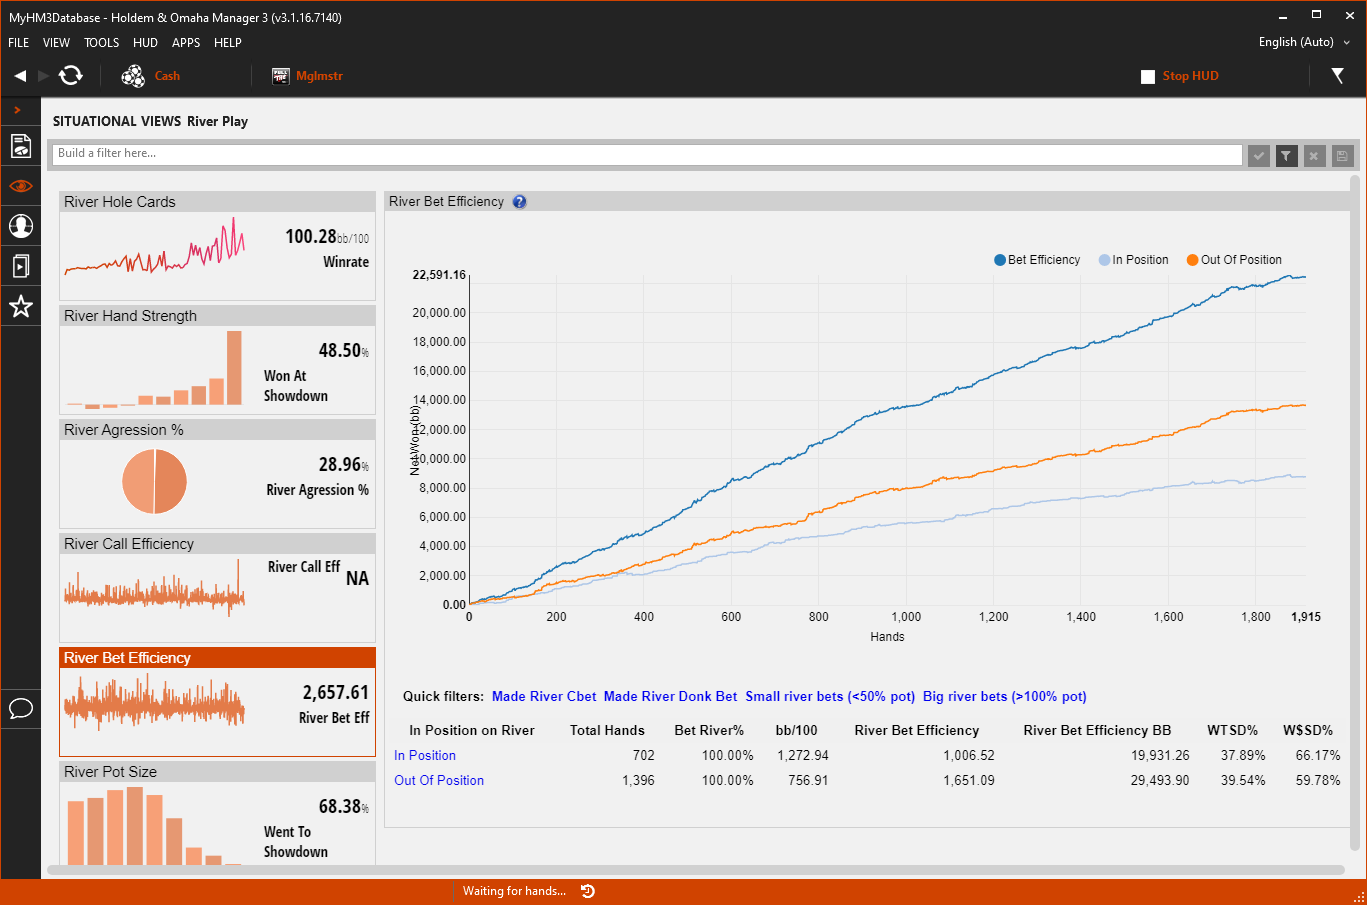
- The "River Bet Efficiency" Tile on the left displays your overall River Bet winnings.
- The main view displays your WinRate in Big Blinds when making River Bets In Position & Out of Position.
- Use the Quick Filters to update the main view Graph when you have:
- Made River Bet
- Made River Donk Bet
- Small River Bets
- Big River Bets
- At the bottom click In Position or Out of Position to load the Holdem Manager 3 Hand View so you can replay and mark hands for review.
6. River Pot Size
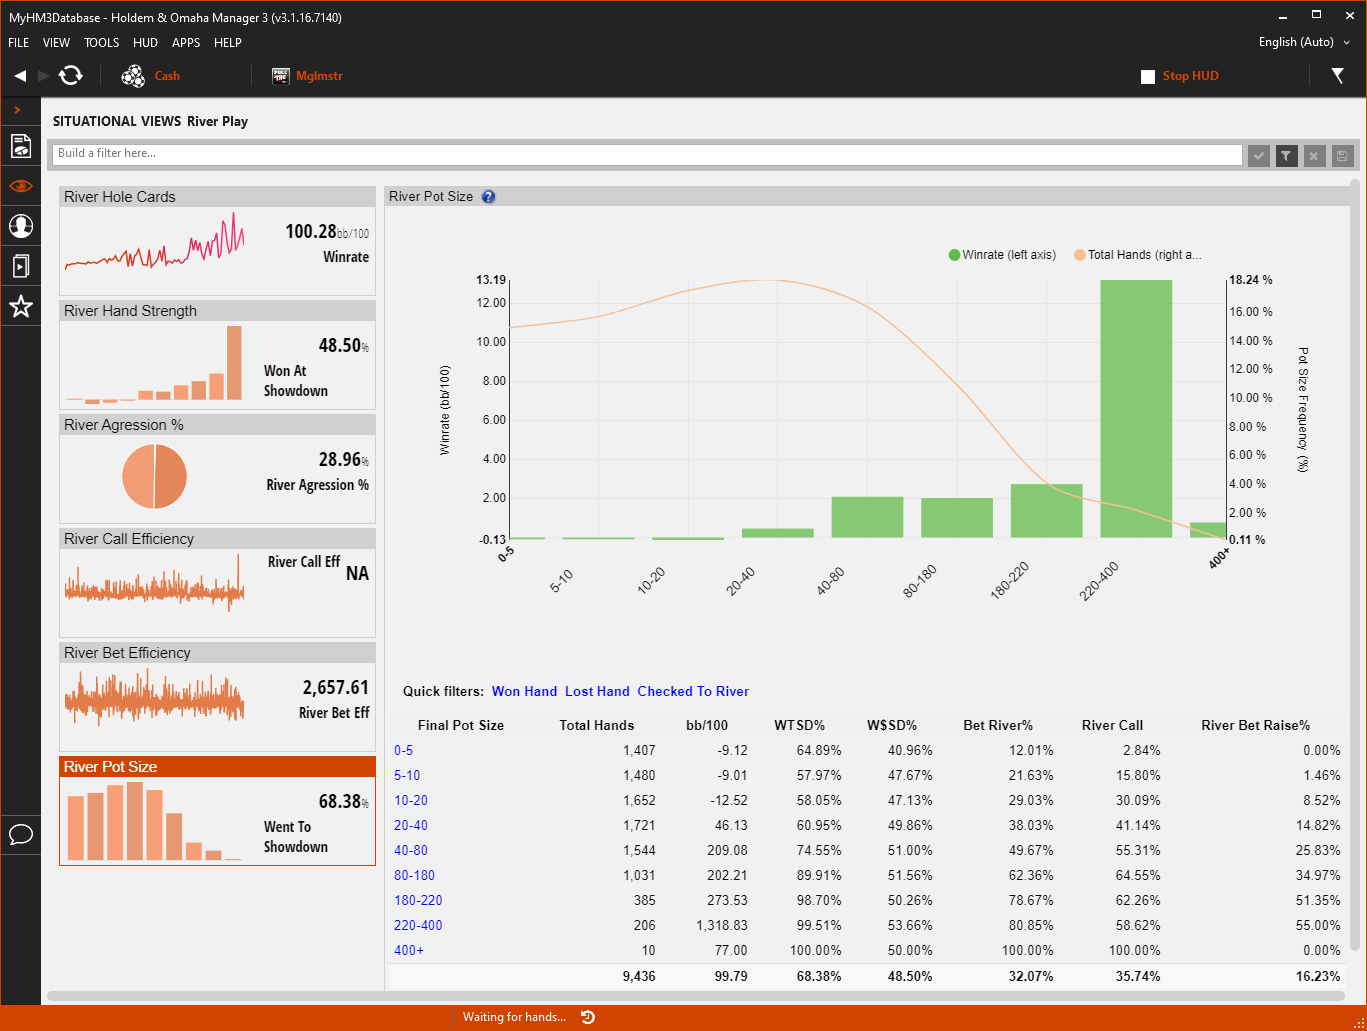
- The "River Pot Size" Tile on the left displays how often you Went to Showdown (WTSD%) when seeing the river.
- The main view displays your WinRate in Big Blinds based on how big the River Bet is.
- Use the Quick Filters to update the main view Graph when you have:
- Won Hand
- Lost Hand
- Checked To River
- At the bottom click one of the Final Pot Sizes to load the Holdem Manager 3 Hand View so you can replay and mark hands for review.
Tournament All-In Situational View
The Tournament: All-In Situational View breaks down the most common Tournament All-In poker situations researched and provides a graphical representation of the data. This makes the data easier to read than a standard report and less filters can be used to view the exact data you are looking for.
- Click the numbered list below the screenshot to view more detailed information.
- Expectation Calling All-In By Stack Size
- Expectation Raising All-In By Stack Size
- Calling All-In Range
- Raising All-In Range
- Calling All-In Results By Position
- Raising All-In Results By Position
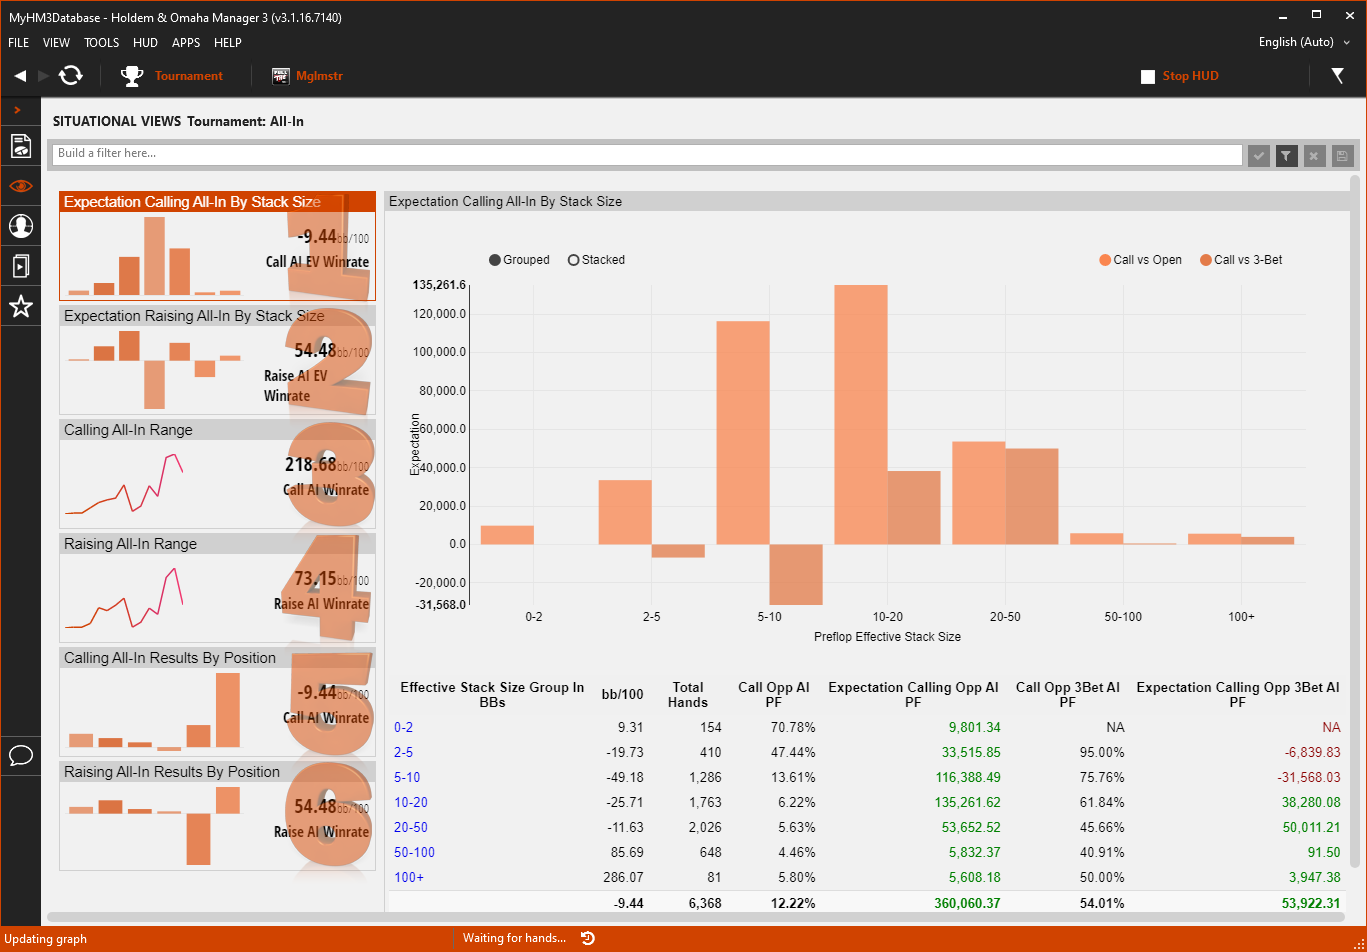
1. Expectation Calling All-In By Stack Size
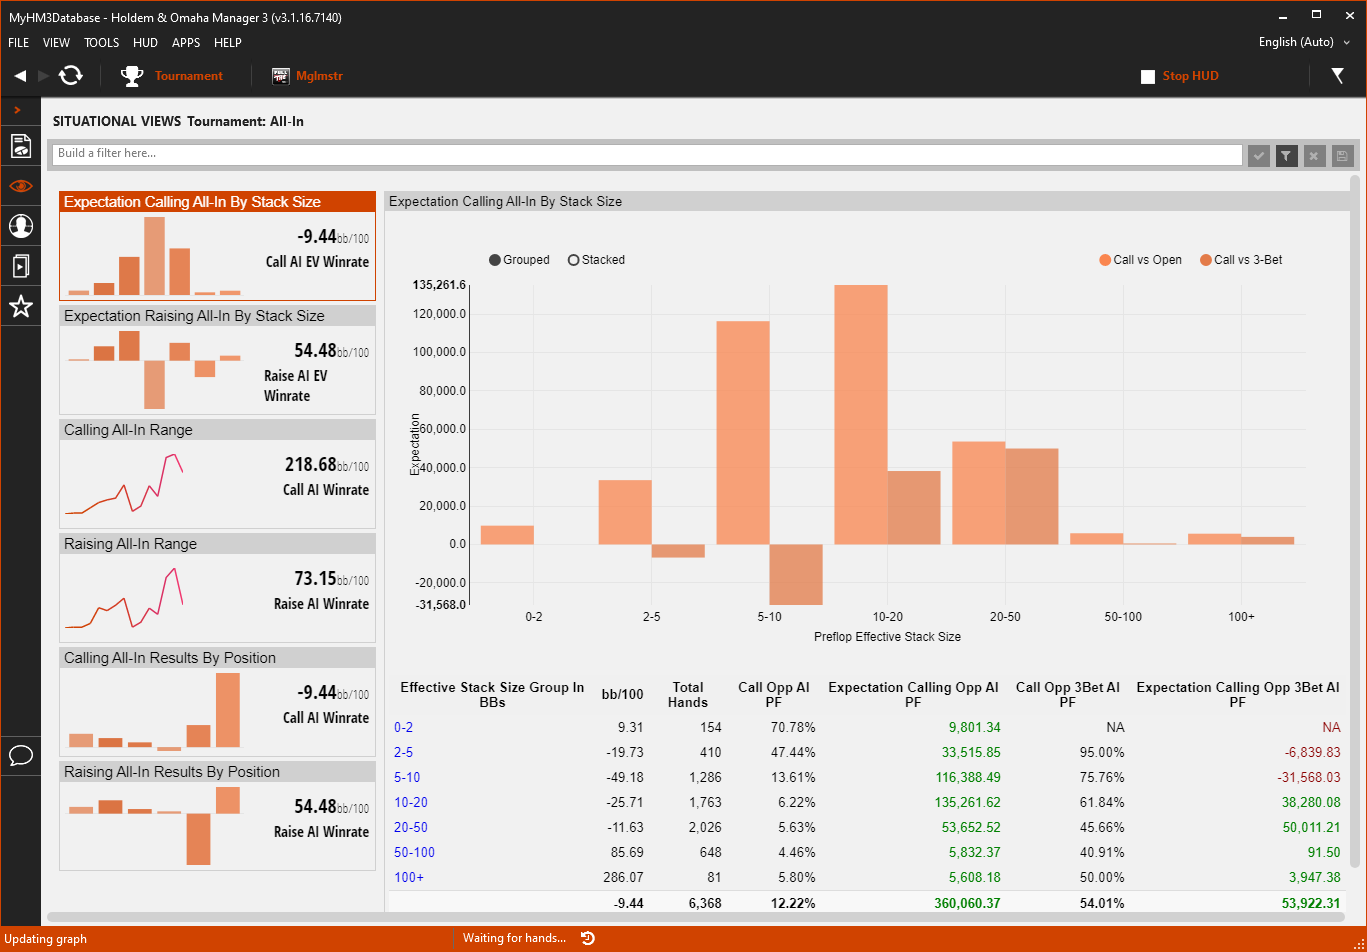
- The "Expectation Calling All-In By Stack Size" Tile on the left displays your overall calling All-In EV WinRate. (Expected Value or All-In Adjusted)
- The main view displays your Call Vs Open (Oragne) and your Call Vs 3-Bet (Dark Orange) expectation by your Preflop Effective Stack Size.
- The bottom of the main view lists your Calling Effecting Stack Size in Big Blinds. Click any of the Effective Stack Sizes at the bottom to load the Holdem Manager 3 Hand View so you can replay and mark hands for review.
2. Expectation Raising All-In By Stack Size
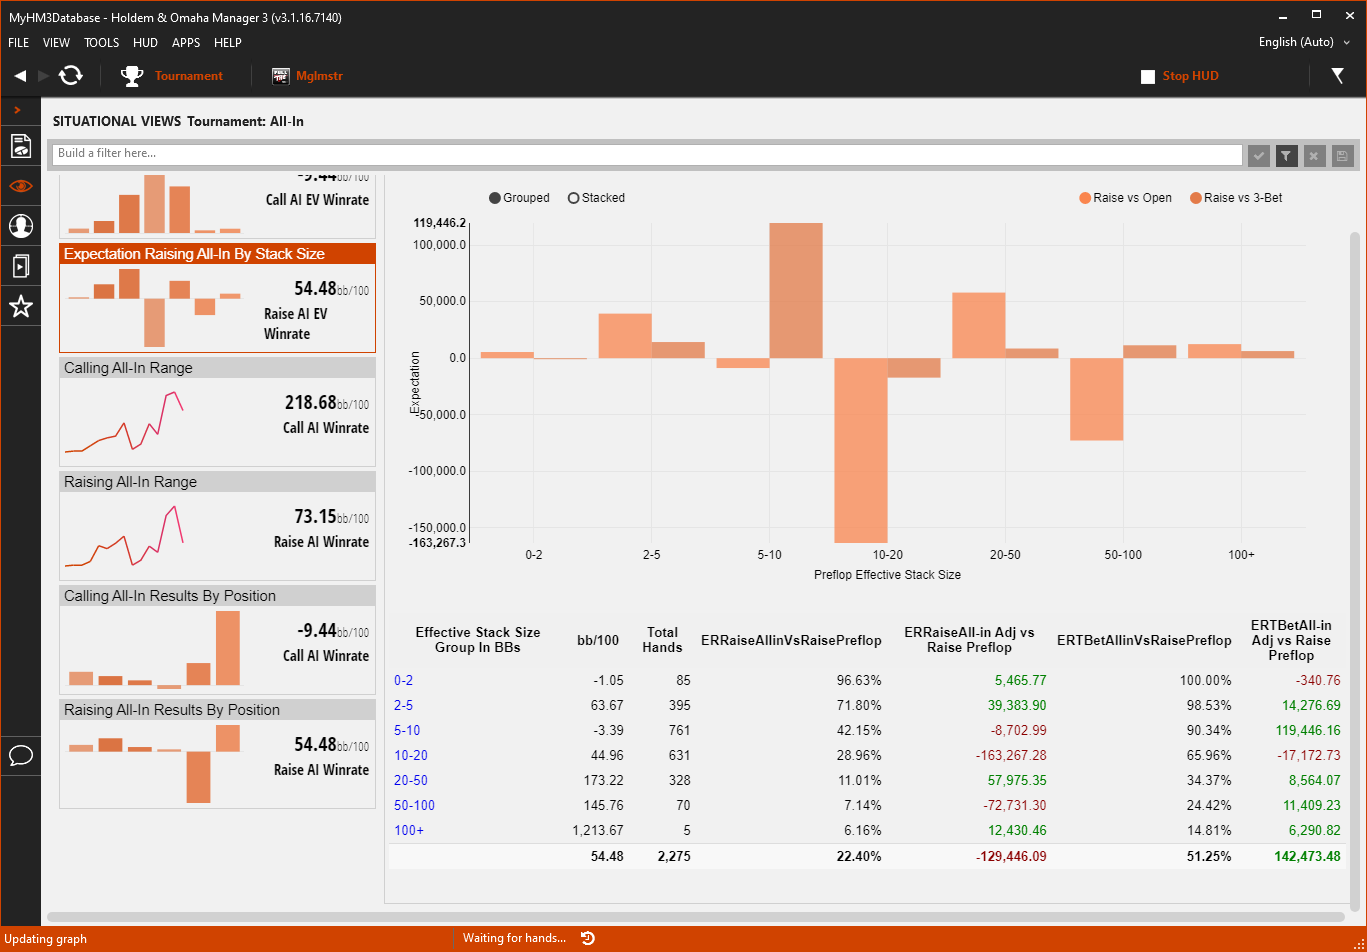
- The "Expectation Raising All-In By Stack Size" Tile on the left displays your Raise All-In EV WinRate by Big Blinds. (Expected Value or All-In Adjusted/BB)
- The main view displays your Raise Vs Open (Orange) and your Raise Vs 3-Bet (Dark Orange) expectation by your Preflop Effective Stack Size.
- The bottom of the main view lists your Raising Effecting Stack Size in Big Blinds. Click any of the Effective Stack Sizes at the bottom to load the Holdem Manager 3 Hand View so you can replay and mark hands for review.
3. Calling All-In Range
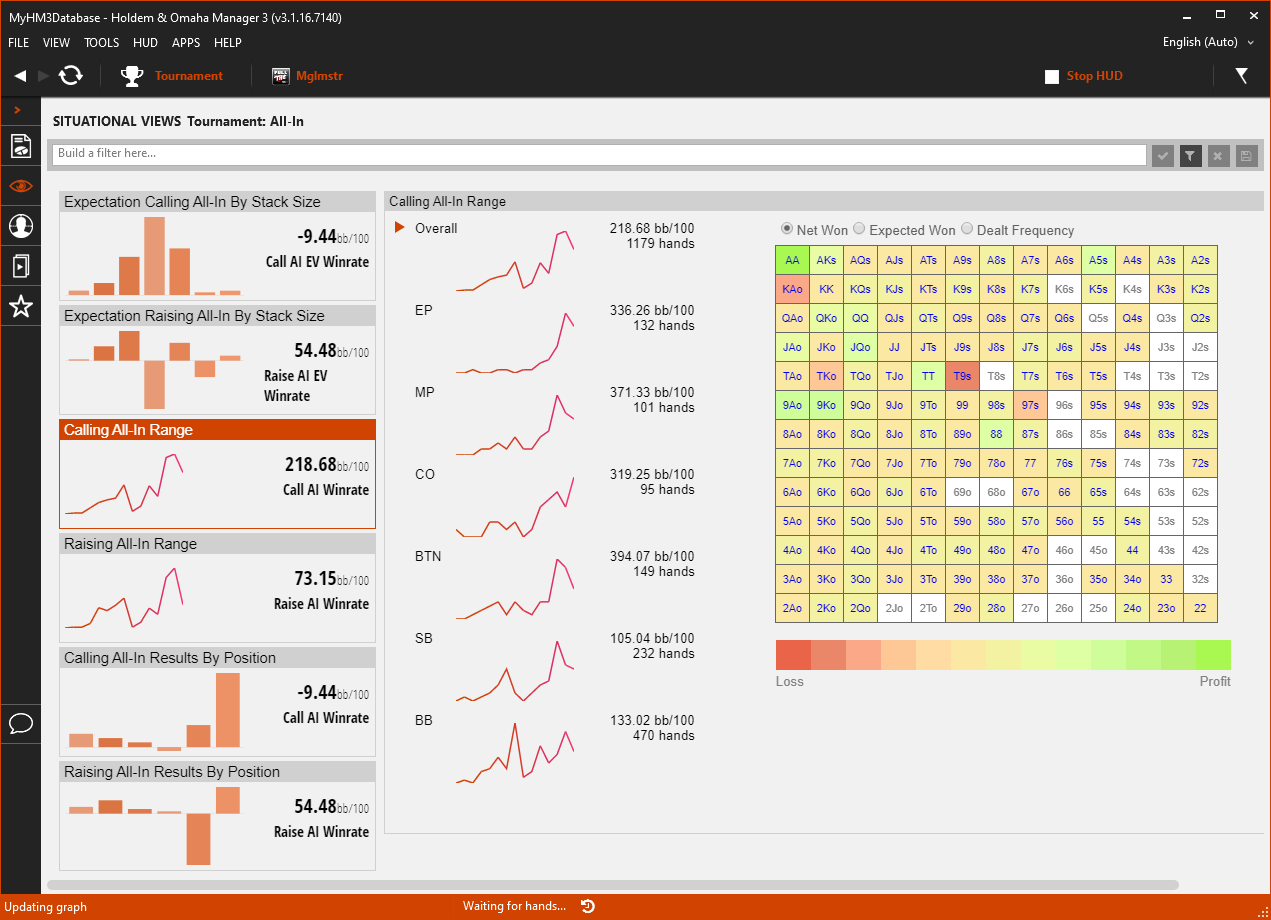
- The "Calling All-In Range" Tile on the left displays your WinRate when Calling All-in's.
- Filter the Hole Card Heat Map by Position or by:
- Net Won
- Expected Won
- Dealt Frequency
- Click any Hole Card in the Heat Map to load the Holdem Manager 3 Hand View to replay and mark hands for review.
4. Raising All-In Range
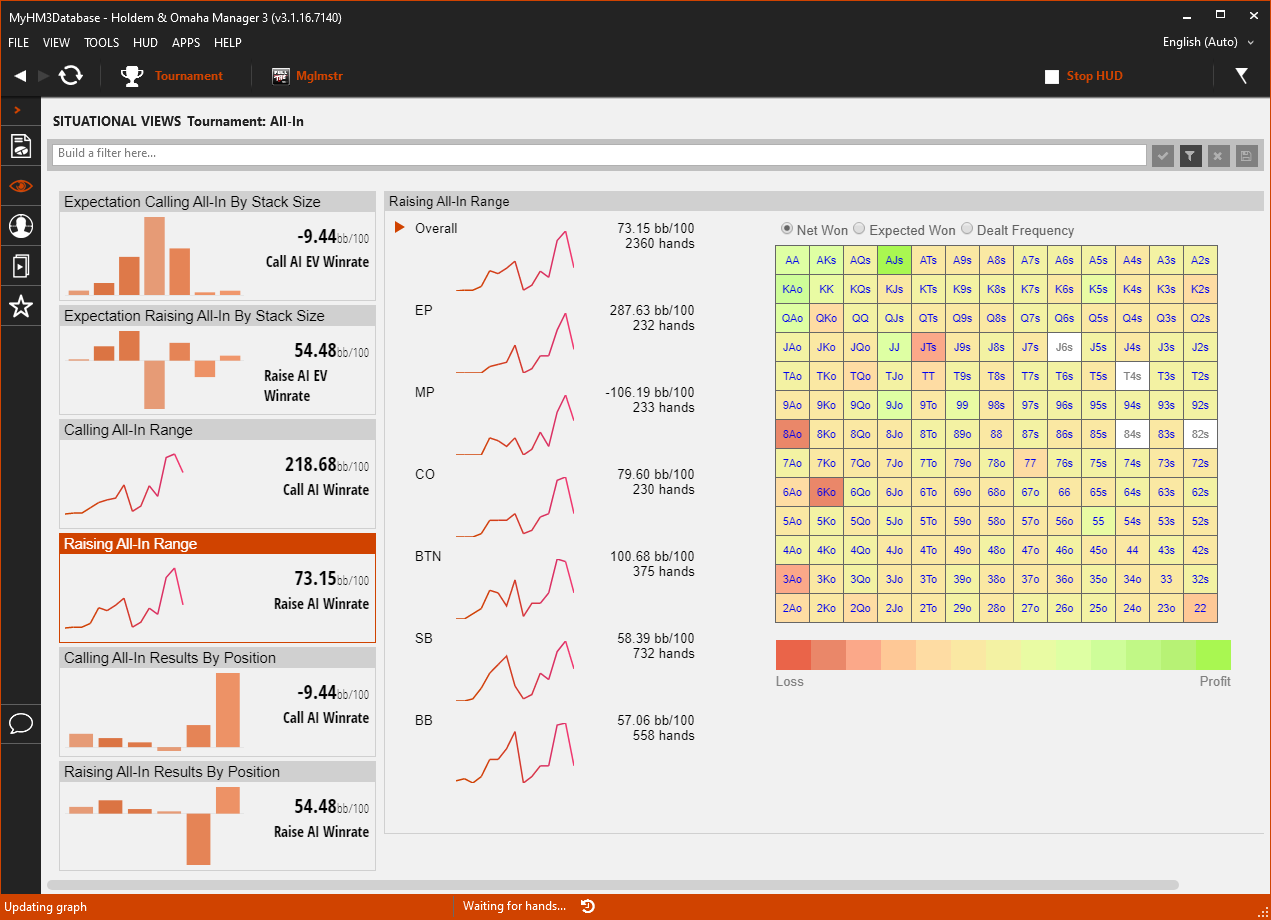
- The "Raising All-In Range" Tile on the left displays your All-In WinRate when Raising. (Big Blinds per 100 hands)
- Filter the Hole Card Heat Map by Position or by:
- Net Won
- Expected Won
- Dealt Frequency
- Click any Hole Card in the Heat Map to load the Holdem Manager 3 Hand View to replay and mark hands for review.
5. Calling All-In Results By Position
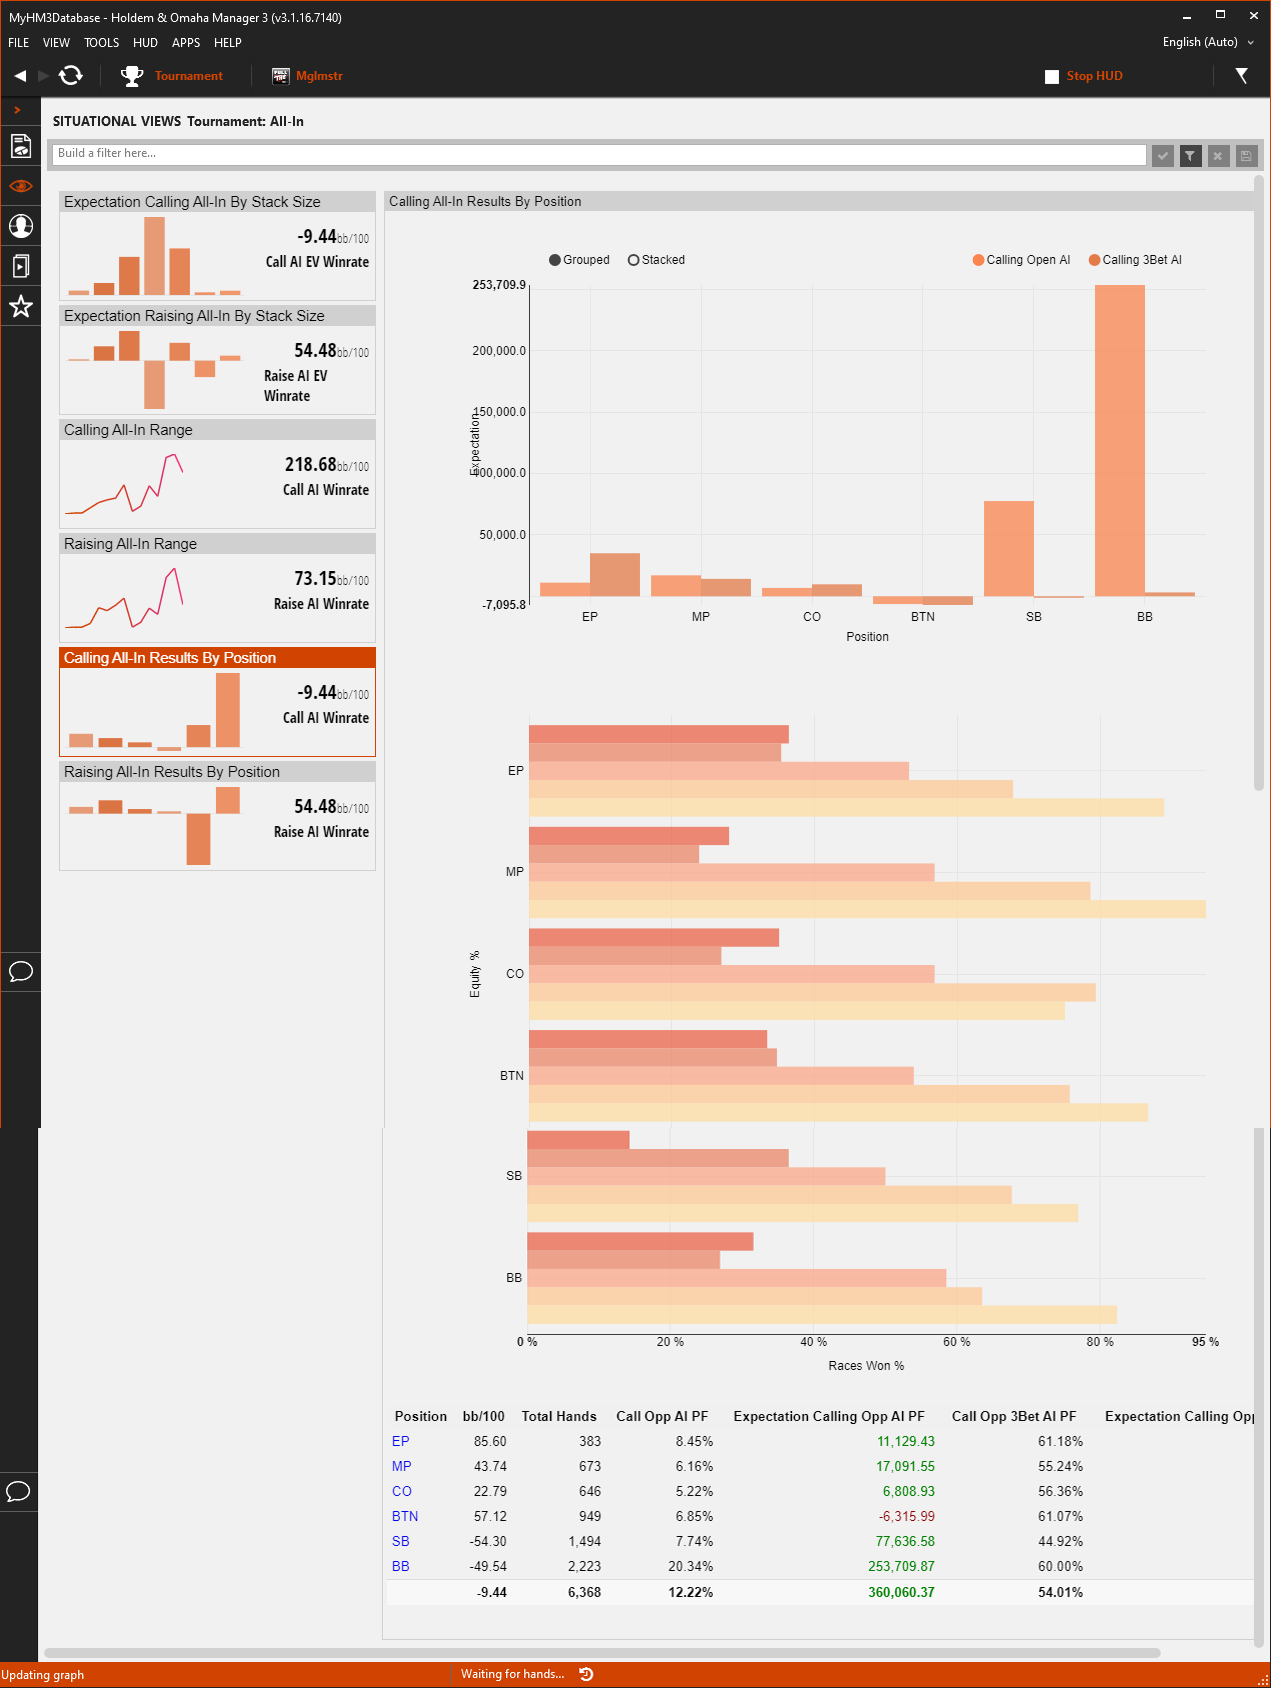
- The "Calling All-In Results By Position" Tile on the left displays your All-In WinRate when Calling. (Big Blinds per 100 hands)
- The top of the main view displays your Expectation (In Chips) by position when Calling an Open All-In or Calling a 3Bet All-In.
- The middle of the main view (Orange horizontal graph) displays your Equity broken down by how likely you were to win the hand when you went All-In.
- Hover your mouse over these Orange Bars to see if your luck (Expectation) is falling within the range it should be.
- At the bottom of the main view click any of the Positions to load the Holdem Manager 3 Hand View to replay and mark hands for review.
6. Raising All-In Results By Position
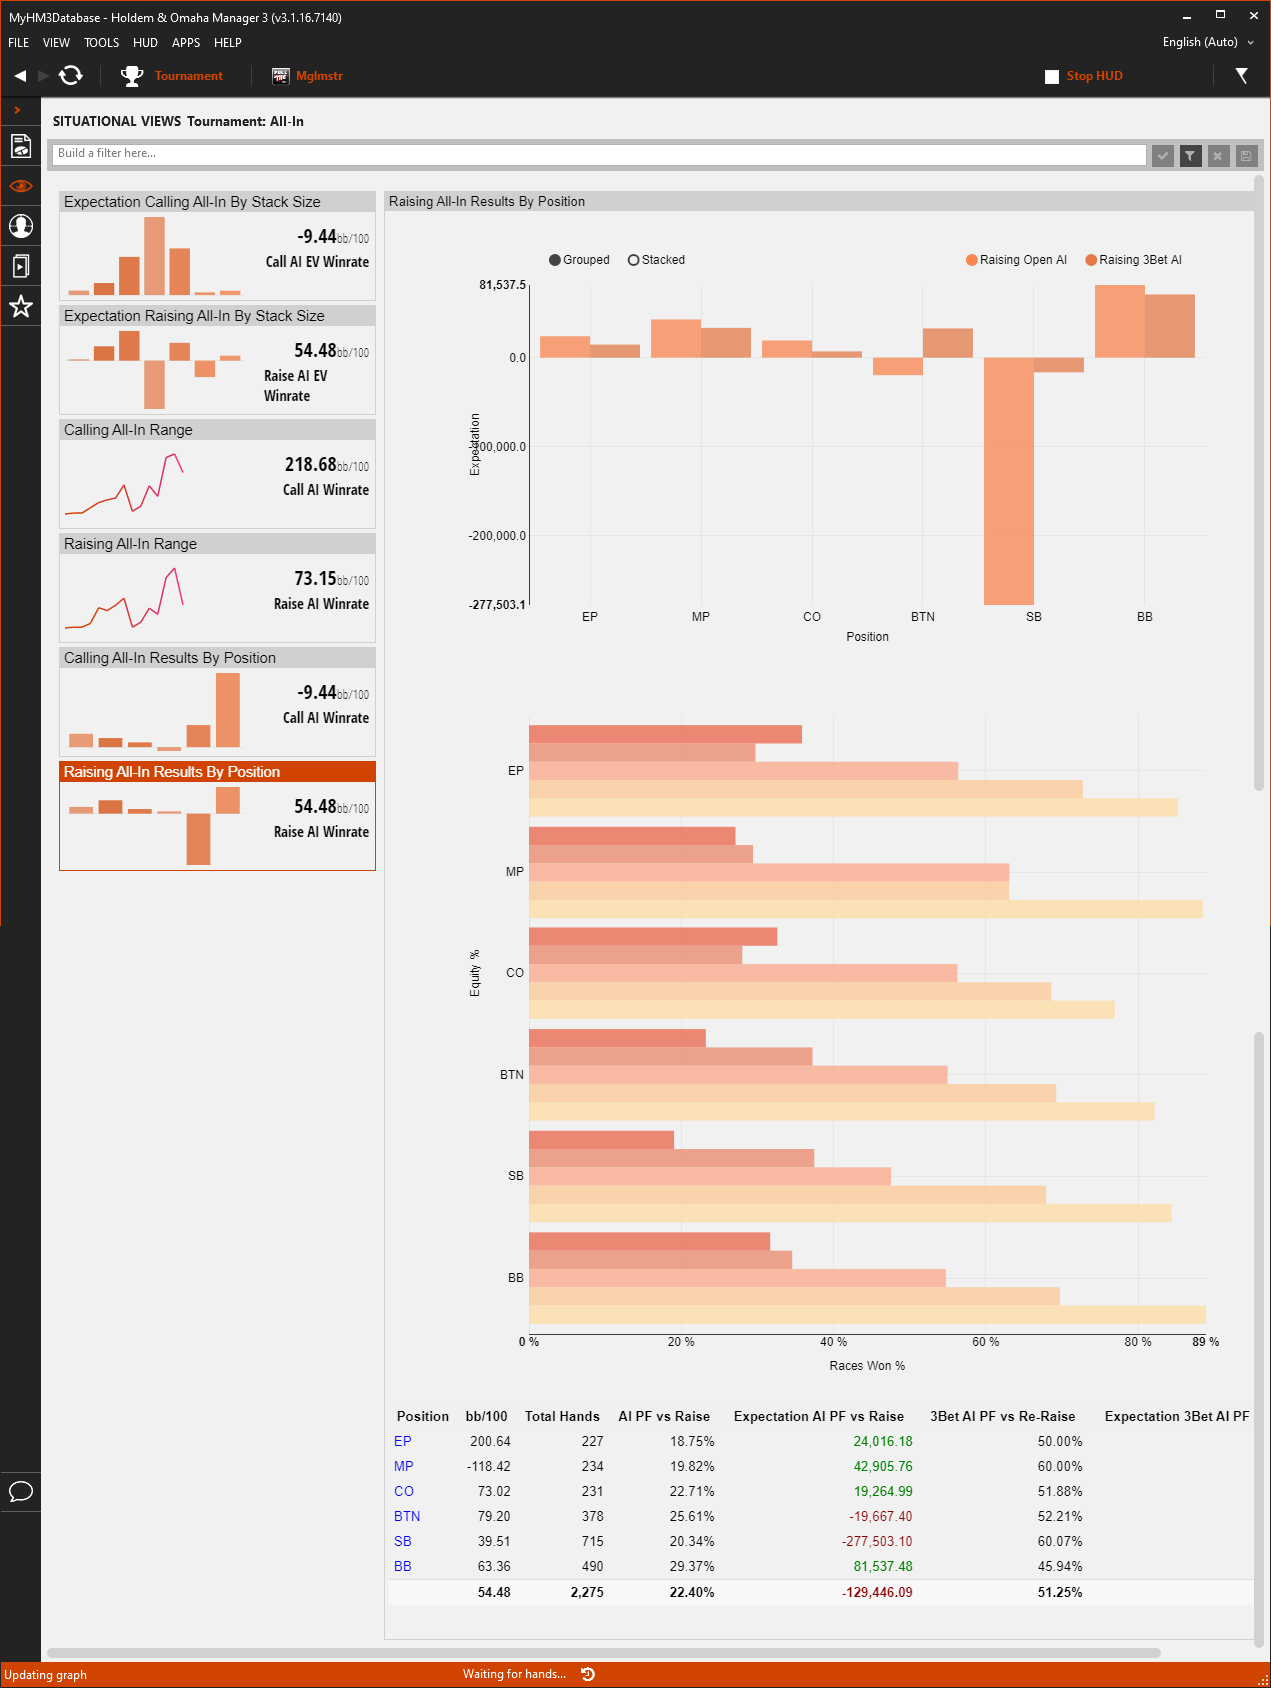
- The "Raising All-In Results By Position" Tile on the left displays your All-In WinRate when Raising. (Big Blinds per 100 hands)
- The top of the main view displays your Expectation (In Chips) by position when Raising an Open All-In or Raising a 3Bet All-In.
- The middle of the main view (Orange horizontal graph) displays your Equity broken down by how likely you were to win the hand when you went All-In.
- Hover your mouse over these Orange Bars to see if your luck (Expectation) is falling within the range it should be.
- At the bottom of the main view click any of the Positions to load the Holdem Manager 3 Hand View to replay and mark hands for review.