|
|
|
Zooming a Graph
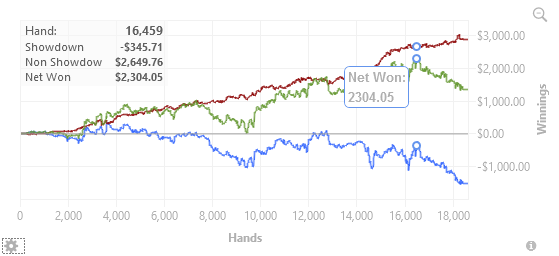
- Left mouse click and drag your mouse over the graph to zoom the graph.
- Click the magnifying glass in the top right to restore your zoomed graph back to it's original size.
Gear Icon (Bottom Left)
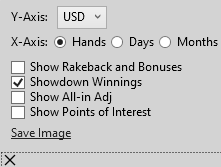
- Y-Axis - Choose what currency you would like your graph displayed as.
- X-Axis - Choose Hands, Days or Months for the bottom horizontal graph point.
- Show Rakeback and Bonuses - Will display a line calculating rakeback and bonuses if you set that up in Tools>Settings (FAQ)
- Showdown Winnings - Displays red line for non-showdown winnings and blue line for showdown winnings.
- Show All-in Adj - Displays a line showing your All In Adjusted Winnings.
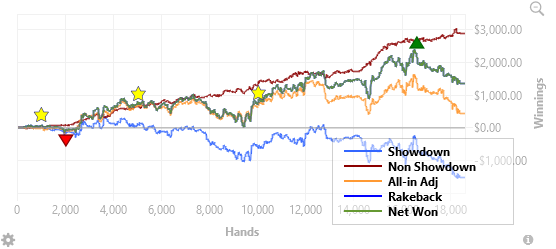
- Show Points of Interest - displays star icons on your graph for 1k, 2k, 3k hands completed along with a green triangle for highest won point and red triangle for lowest won point.
- Save Image - Save your graph out as a .png file on your hard drive.
Legend Icon (Bottom Right)
Displays what the colored lines are in the graph.